

What the module calculates
Triangular strip load gives the vertical stress increase Δσz in the ground below a flexible strip load whose intensity rises in a straight line across its width: zero at one edge, q at the other. The strip is infinitely long, so the problem is the same in every cross section (plane strain), and the ground is a homogeneous, isotropic, linearly elastic half-space. It is the load of a fill that tapers out, of a stockpile that is heaped against a wall, or of the toe of an embankment.
B is the width of the strip, x is measured from the zero edge toward the high edge, α is the angle the strip subtends at the point and δ is the angle from the vertical through the point to the line to the high edge, taken with its sign. You give the strip, the point A and the depth of the profile; the module gives Δσz at A, Δσz/q, the lines of equal stress, colour contours, the profile under A and a 3D view.
What you can describe
- Up to eight strips. Each has its own q, width B, left edge xL and direction (zero at the left edge or zero at the right edge). The stresses of the strips add.
- A point A at a horizontal position x and a depth z; the stress at A is given and the profile under A runs from the surface to zmax.
- Strips that meet at an edge are allowed; strips that overlap are not.
Which module for what
- A strip of uniform pressure, or a horizontal (shear) load on a strip: Vertical strip load and Horizontal strip load. A fill with sloping sides: Embankment.
- Loads that are not strips: Point load, Vertical line load, Rectangle, Circle, any point, Influence chart for any shape, and the Westergaard solutions for layered ground: point load and areas.
- The lateral pressure that a triangular load puts on a wall is a different calculation: Surcharge, triangular load.
- This module gives the stress increase caused by the strips. The module states that the overburden pressure of the soil above A is not included; add it, and take the settlement or the bearing check, in your own calculations.
Before you start: what you need
Have these ready:
| What | Notes |
|---|---|
| The load of each strip | q, the load per unit area at the high edge, and the direction: which edge carries zero. The load is zero at the other edge and falls in a straight line between them. |
| The width B and the place xL | The width of each strip, and the position of its left edge along the horizontal axis x, which you choose. For one strip, put the left edge at 0. |
| The point A | Its horizontal position x on the same axis (negative to the left of 0) and its depth z below the surface. |
| The depth of the profile zmax | How deep the profile table and the Profile view go under A. |
Quick start in seven steps
- Open the module and choose the units
Open Triangular strip load from the Stresses in a Soil Mass family. At the top right choose SI · kN, SI · tf or US; you can change it at any time.
- Describe the strip
In Triangular strip loads choose Zero at left or Zero at right in the New strip load form, type q, B and xL, and press + Add strip load. The first strip already exists: edit its row, or press + Add strip load for another.
- Add more strips if you have them
Repeat for each strip, up to eight. Strips may touch but not overlap.
- Place the point A
Press Next and type x and z in Point A, or drag A on the drawing.
- Set the depth of the profile
Press Next and type zmax in Depth profile, or drag the dashed line on the drawing.
- Press Analyze
Press Analyze in the bar at the foot of the Model tab. The bar reads Analysed — the stress at the point calculated and the model locks, except the point A and the depth of the profile.
- Read the answer, the working and the report
The Results tab gives Δσz at A; Calculations gives the working; Report saves a PDF or a Word file.
The screen: four views, and what you can drag
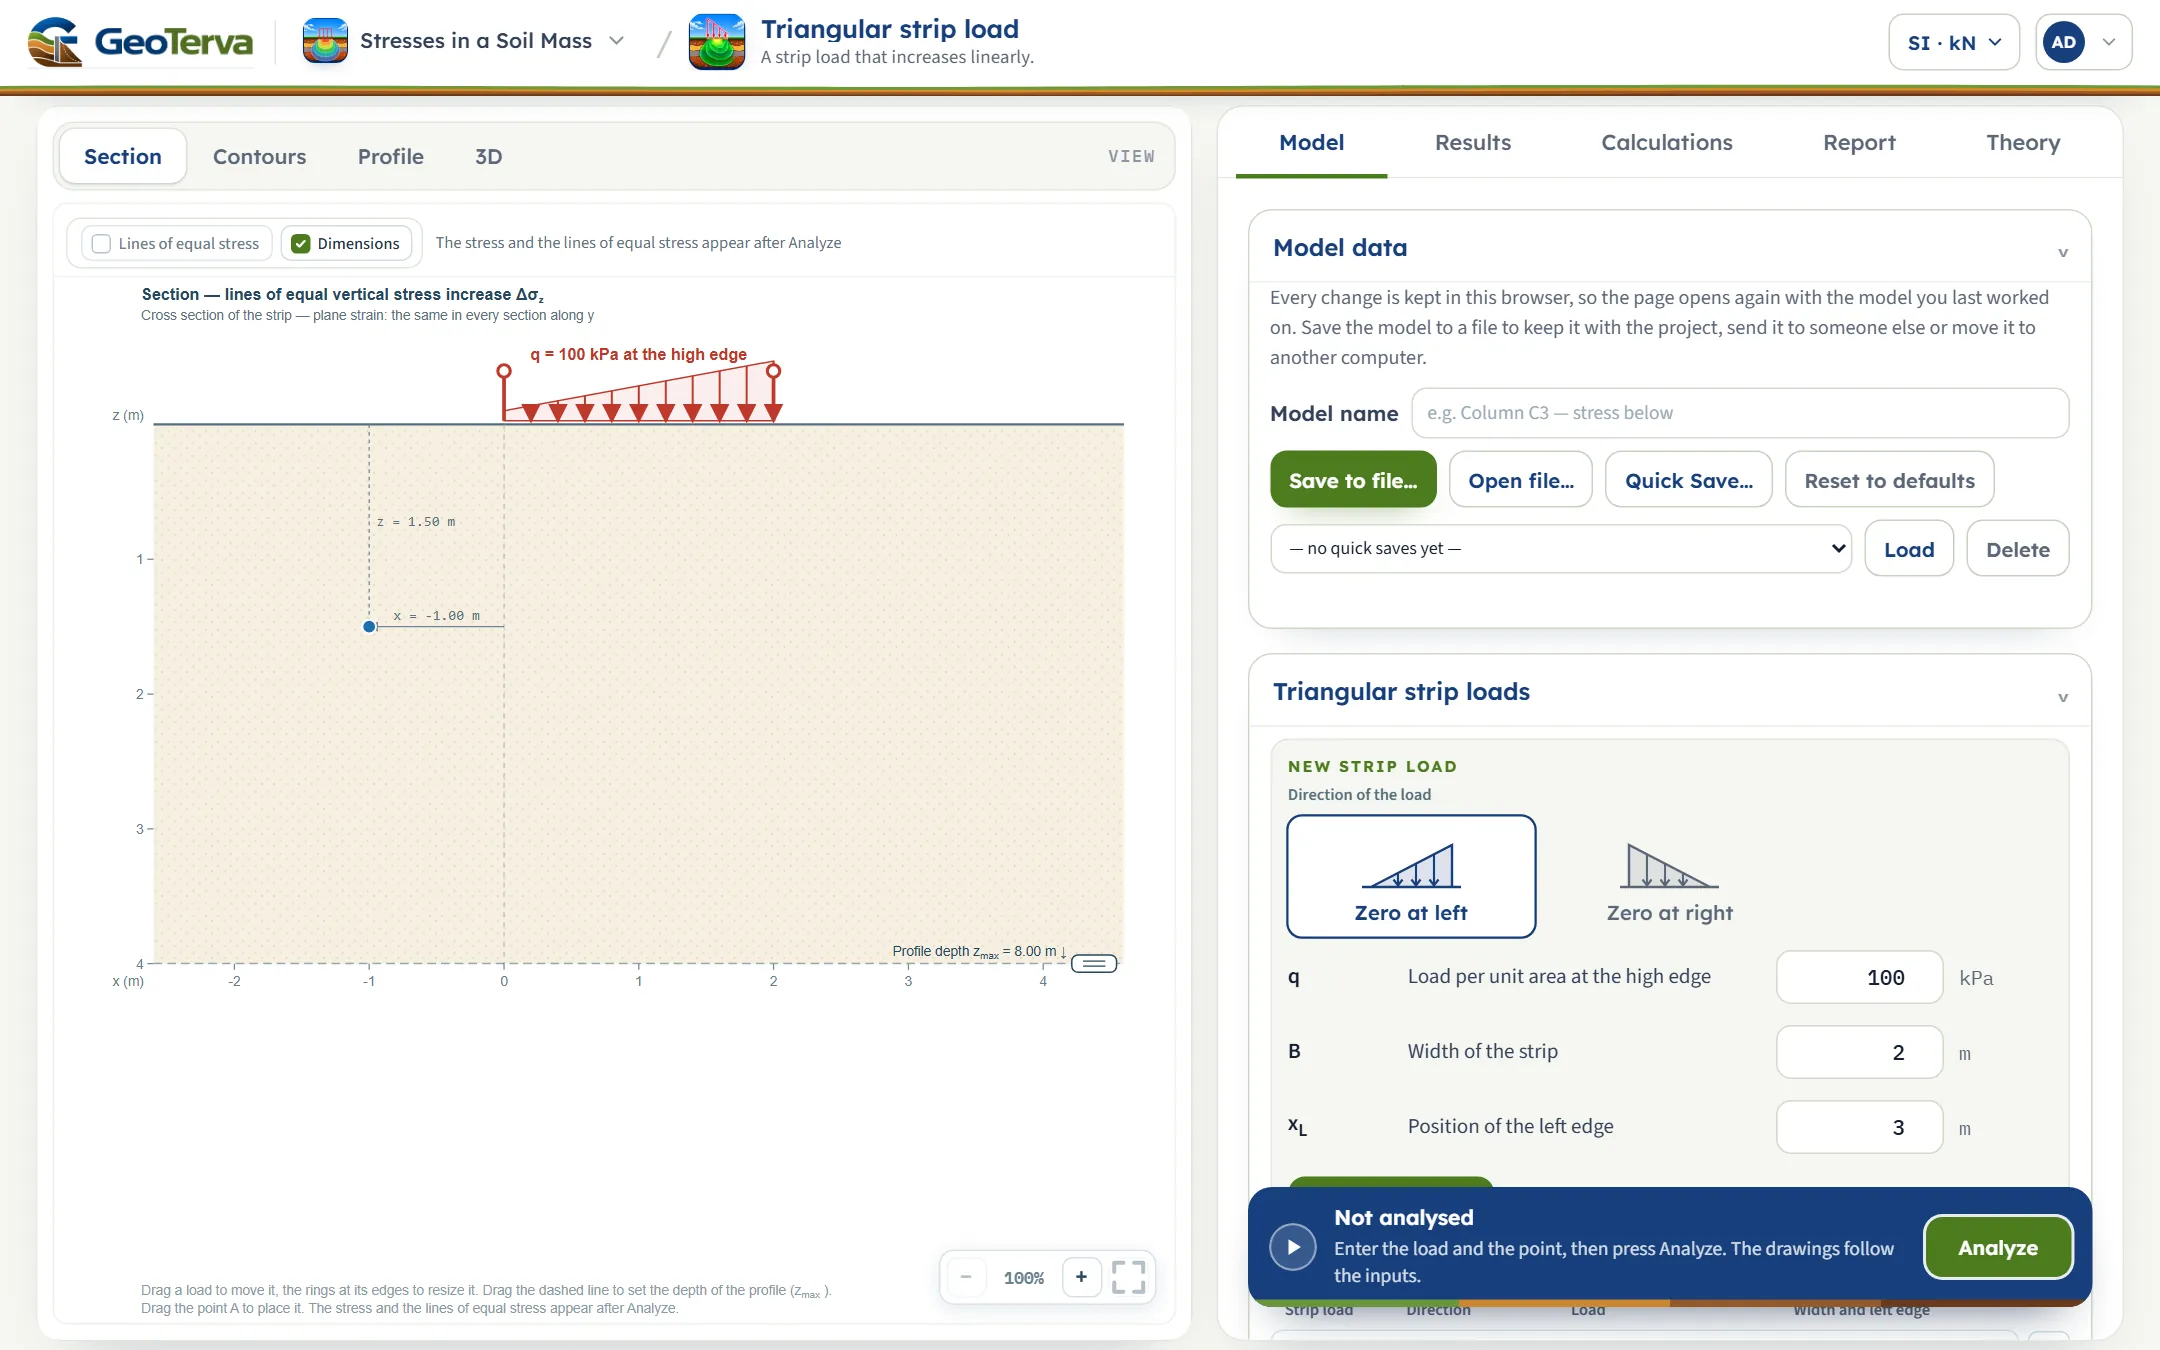
The layout is the one every GeoTerva module shares, described in the workspace guide. The drawing on the left has four views, chosen with the buttons above it: Section, Contours, Profile and 3D. On the right are the tabs Model, Results, Calculations, Report and Theory.
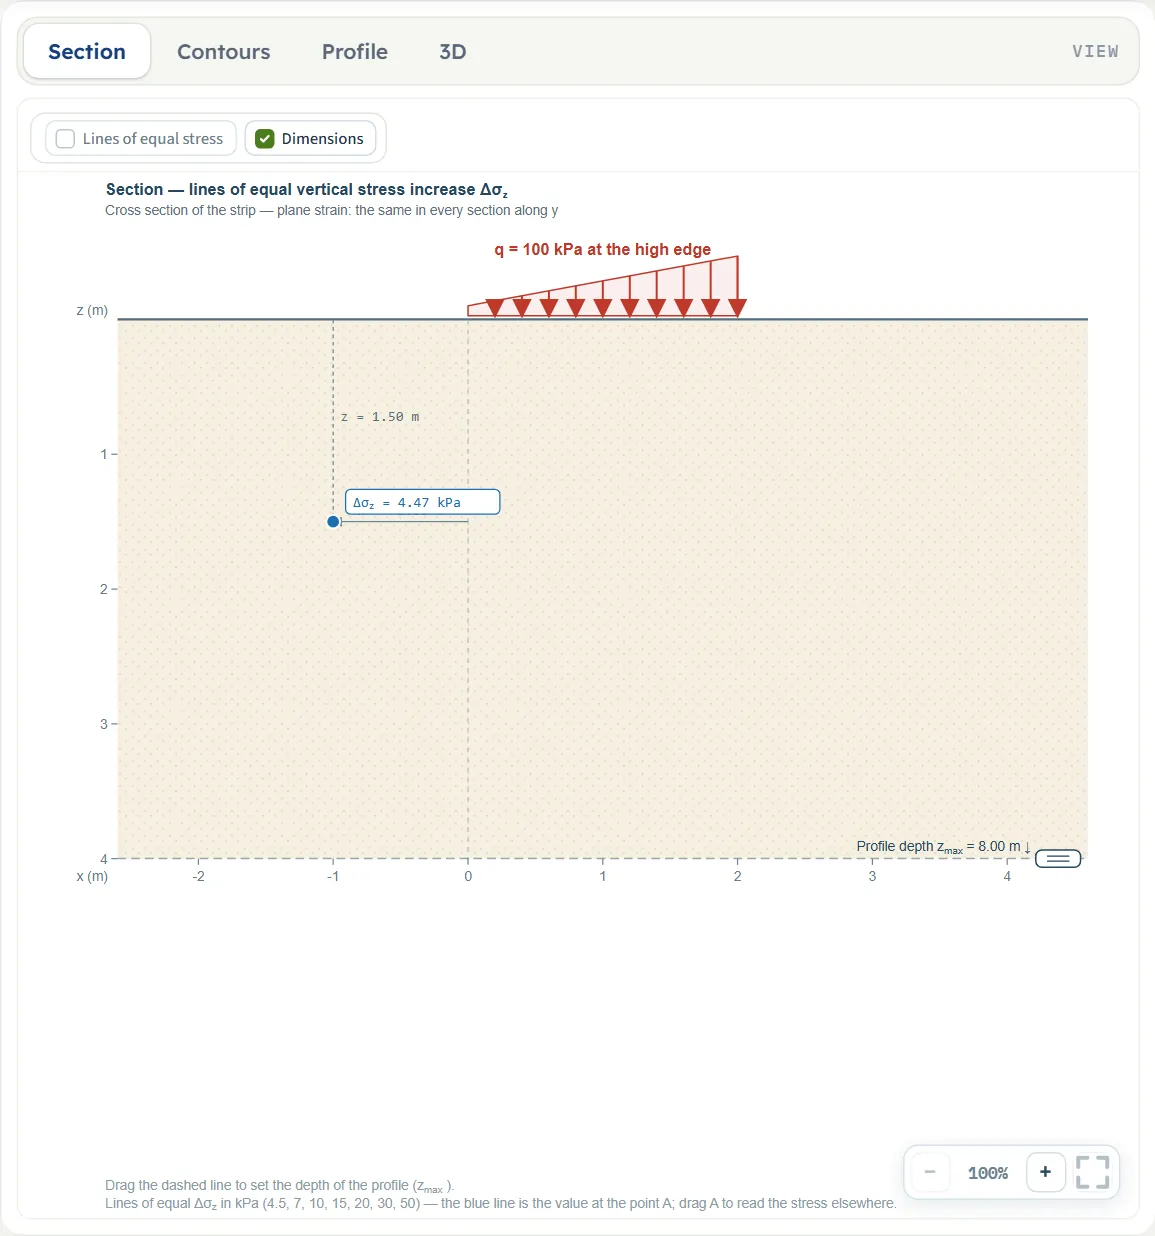
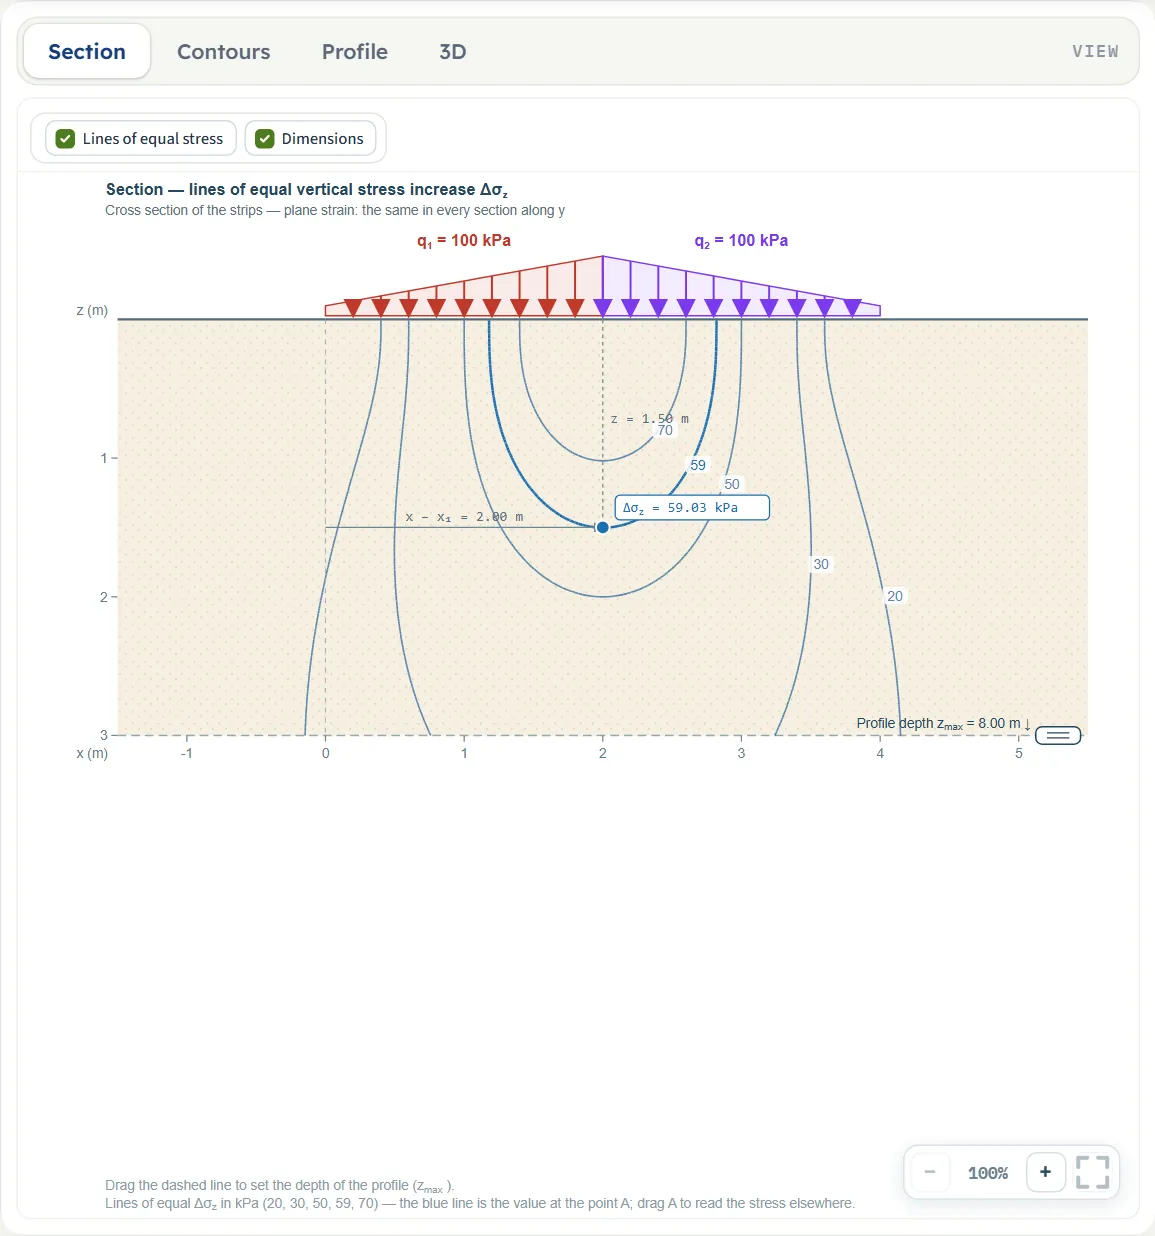
- Section draws the strips on the ground with their loads, the point A and, after Analyze, the lines of equal vertical stress in the vertical plane through A, with the stress at A in a box. Its foot notes say which lines are drawn (4.5, 7, 10, 15, 20, 30 and 50 kPa for the example) and that the blue line is the value at A.
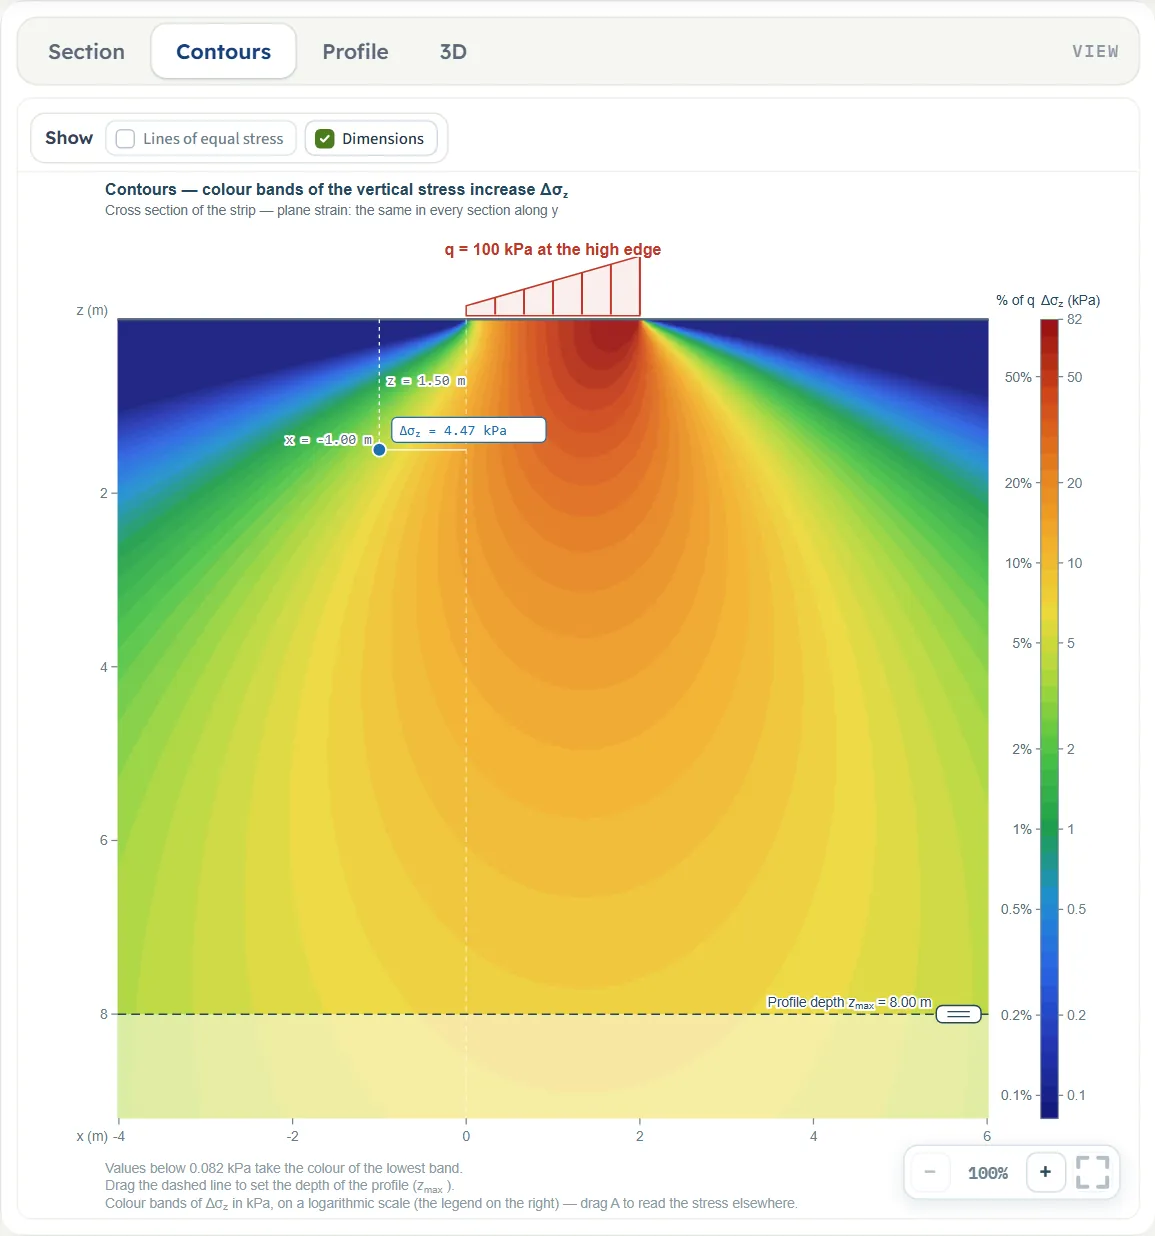
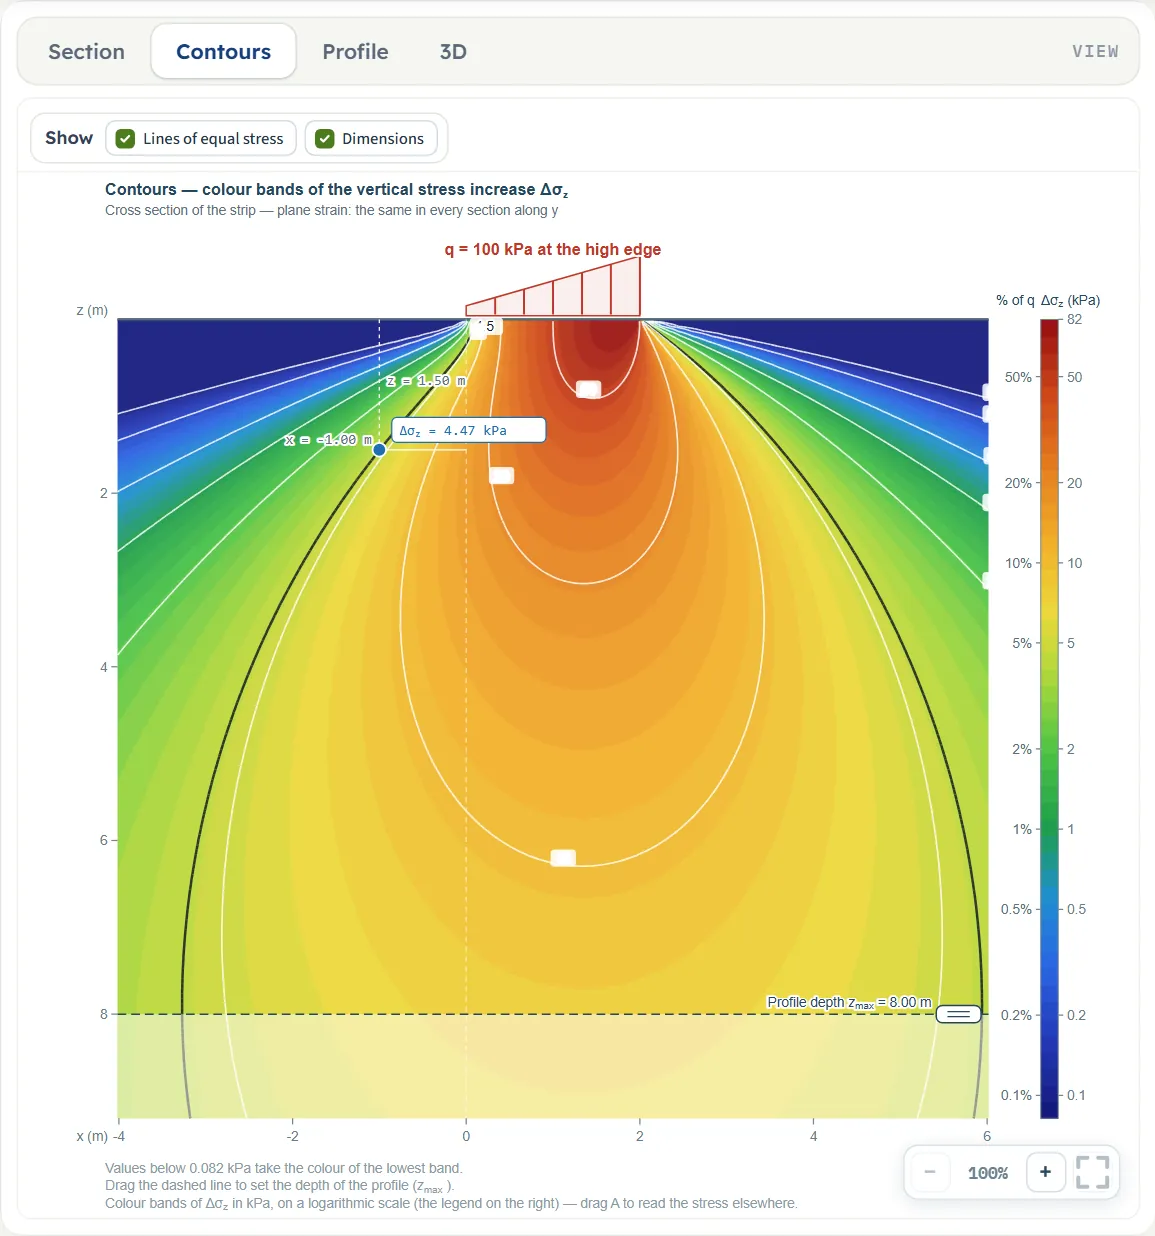
- Contours shows the same section as colour bands on a logarithmic scale, with a legend in kPa and as a percentage of q; values below the lowest band take its colour.
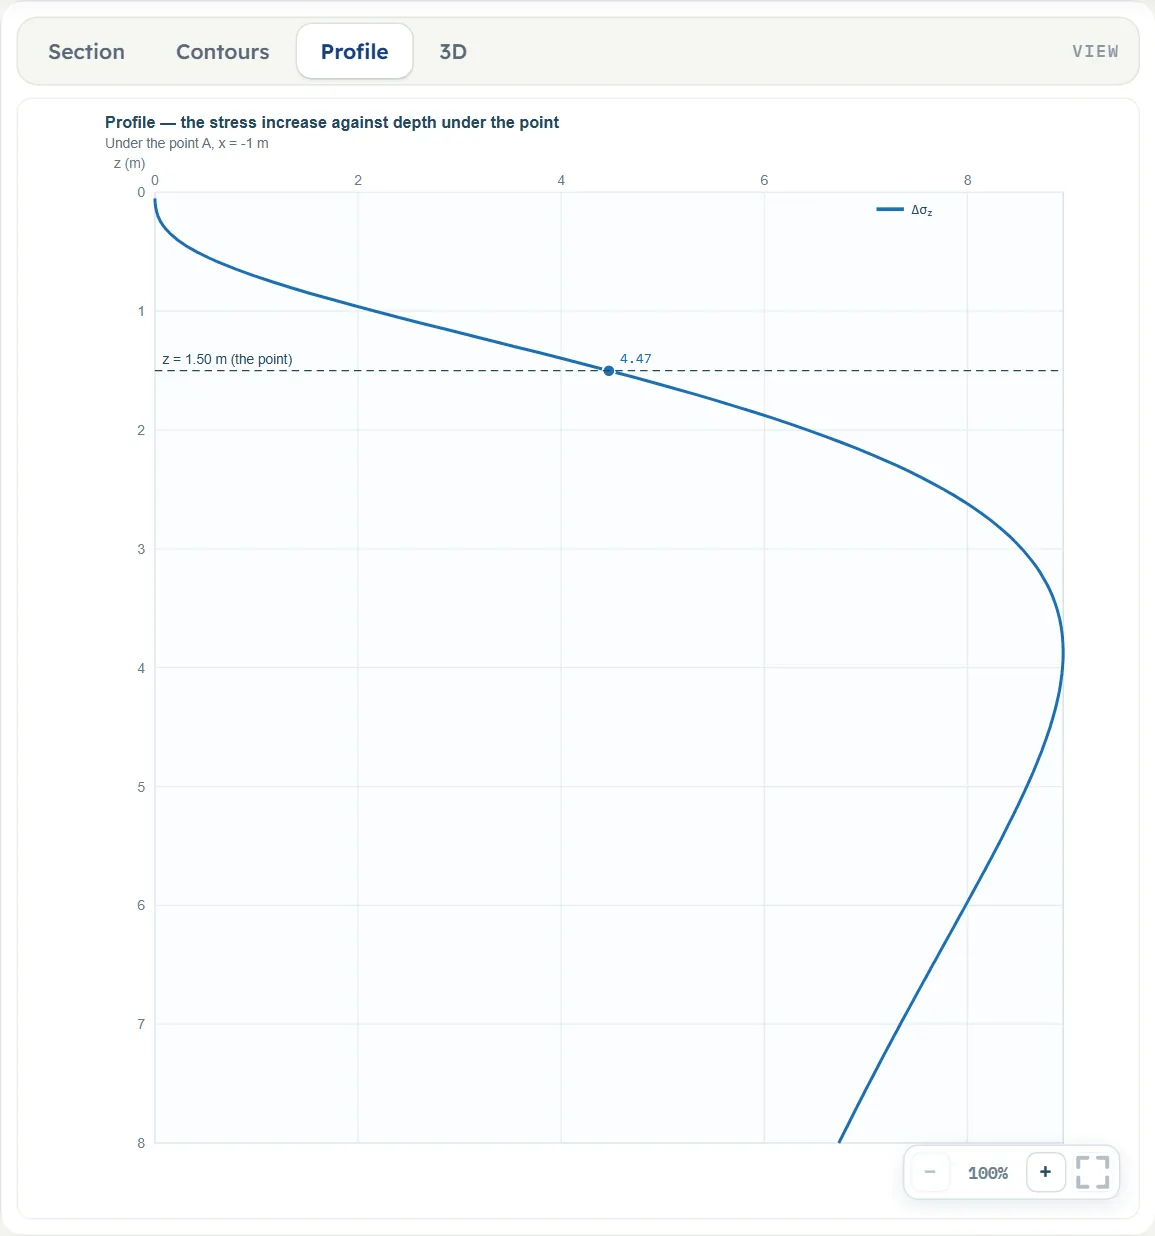
- Profile plots Δσz against depth under A, with the depth of A marked.
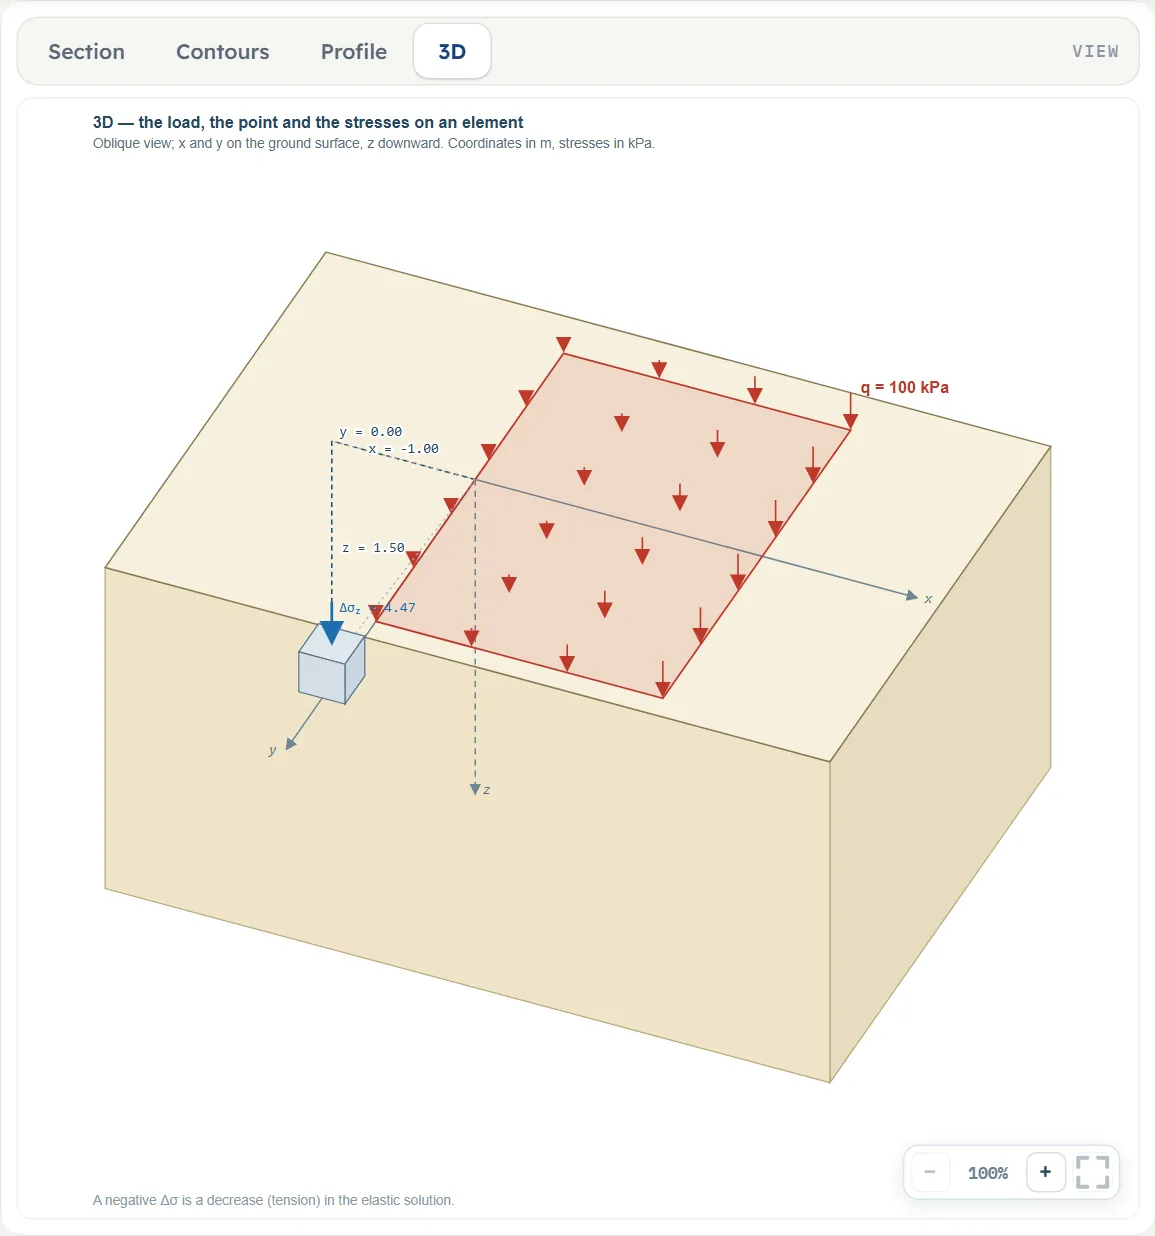
- 3D shows the strips on the ground, the axes, the coordinates of A and, after Analyze, the stress on an element at A.
Before Analyze the Section view shows the model. The rings at the ends of a strip are its handles. The dimensions mark A.
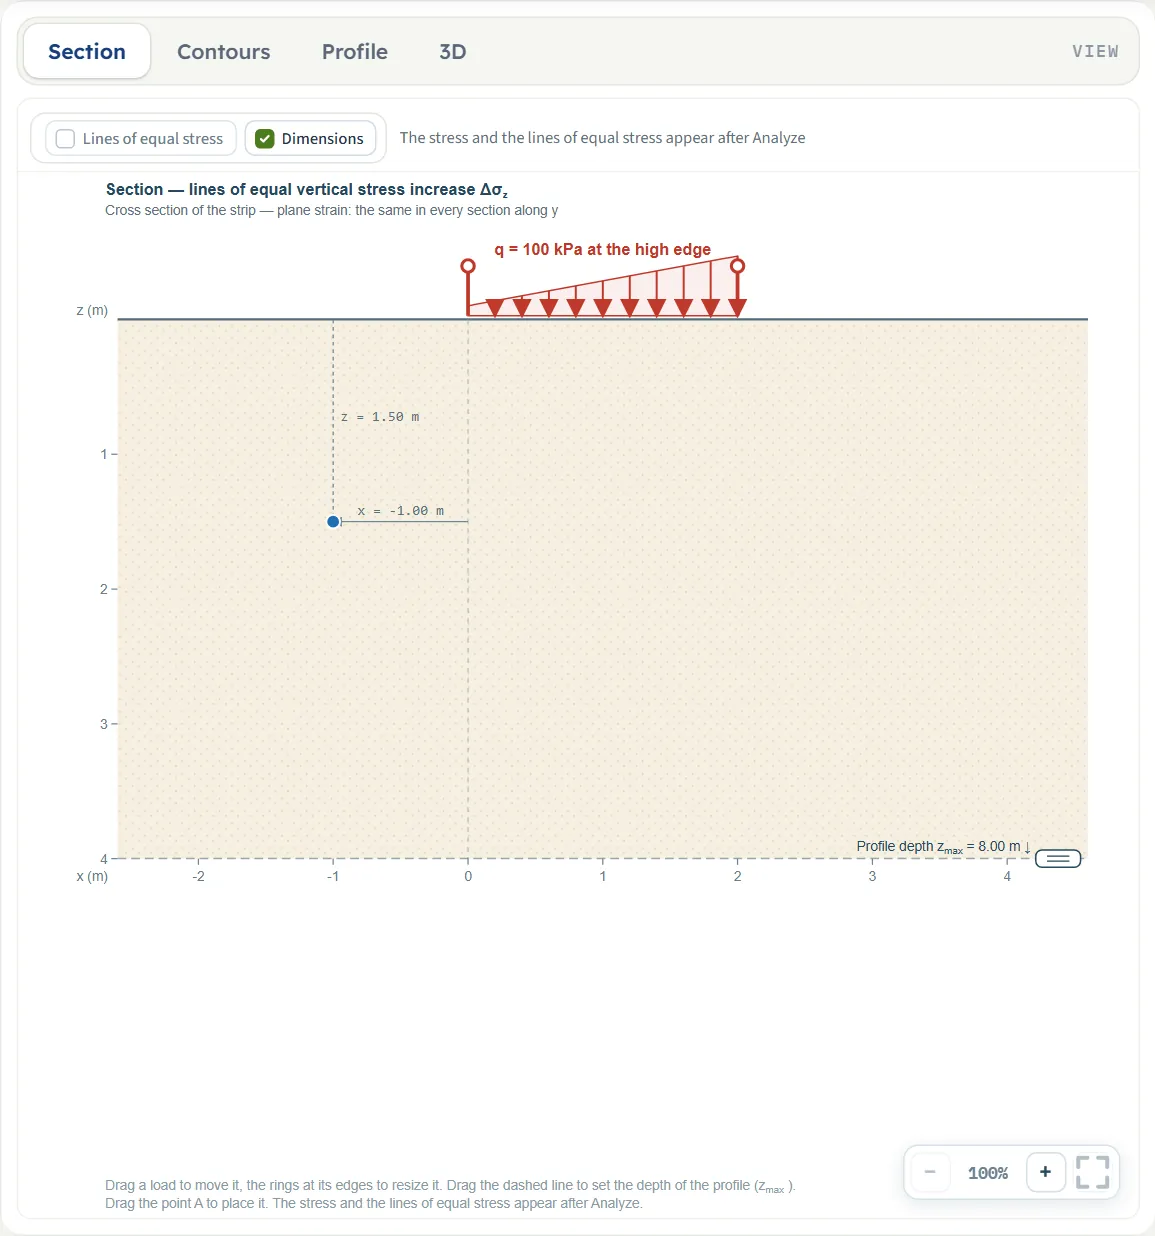
After Analyze the lines of equal stress appear. The blue line passes through A and the box gives Δσz = 4.470 kPa.
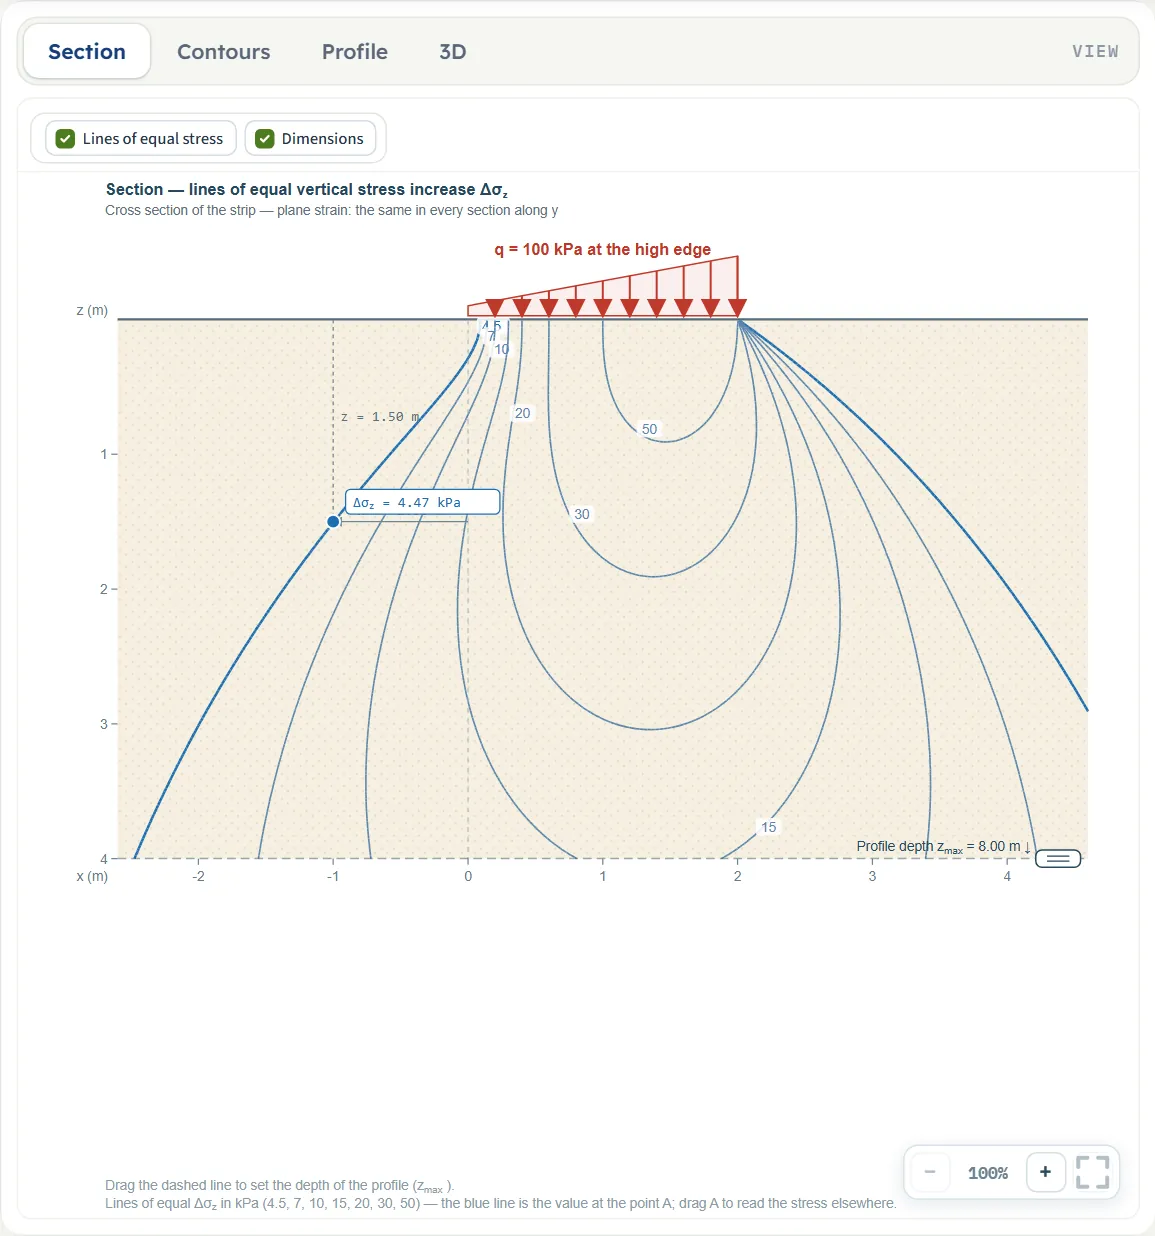
The Contours view paints the field of Δσz. The strip stands on top of it; the section is drawn down to a little below the profile depth.
The Profile view is the curve under A. For the example it rises to a maximum at about 4 m and then falls.
The 3D view, with the element at A and the stress on it.
The Show chips
Lines of equal stress and Dimensions sit above the Section and the Contours view. Before Analyze the lines chip is unchecked and greyed, with the note “The stress and the lines of equal stress appear after Analyze” (in the Contours view: “The colour contours of the stress appear after Analyze”). After Analyze the Section view has the lines on; the Contours view starts with them off, so you can put the lines on the colours. Dimensions switches the dimension marks of A on or off. Profile and 3D have no chips.
Dragging on the drawing
- A strip, before Analyze: drag its body along the ground to move it (xL changes, the width stays); drag the ring at its left edge to change the width and the left edge together (the right edge stays); drag the ring at its right edge to change the width. A pull moves in steps of 5 cm; a width cannot go below 0.1 m. The same handles are on the strips of the 3D view.
- Strips never overlap. If a pull would put a strip on another, it stops where the strips touch and the notice “That would put strip load 1 and strip load 2 on top of one another — the value is kept as it was.” appears.
- The point A: drag the blue point in the Section or the Contours view, before and after Analyze. It moves in steps of 5 cm inside the frame of the drawing, never above 0.05 m depth. After Analyze the stress is recalculated at once for the new place.
- The profile depth: drag the dashed line; it stops at 0.5 m at the least. It stays free after Analyze, like the point A.
- After Analyze the strips are locked: their handles disappear and their boxes are greyed. Edit inputs unlocks them and clears the results.
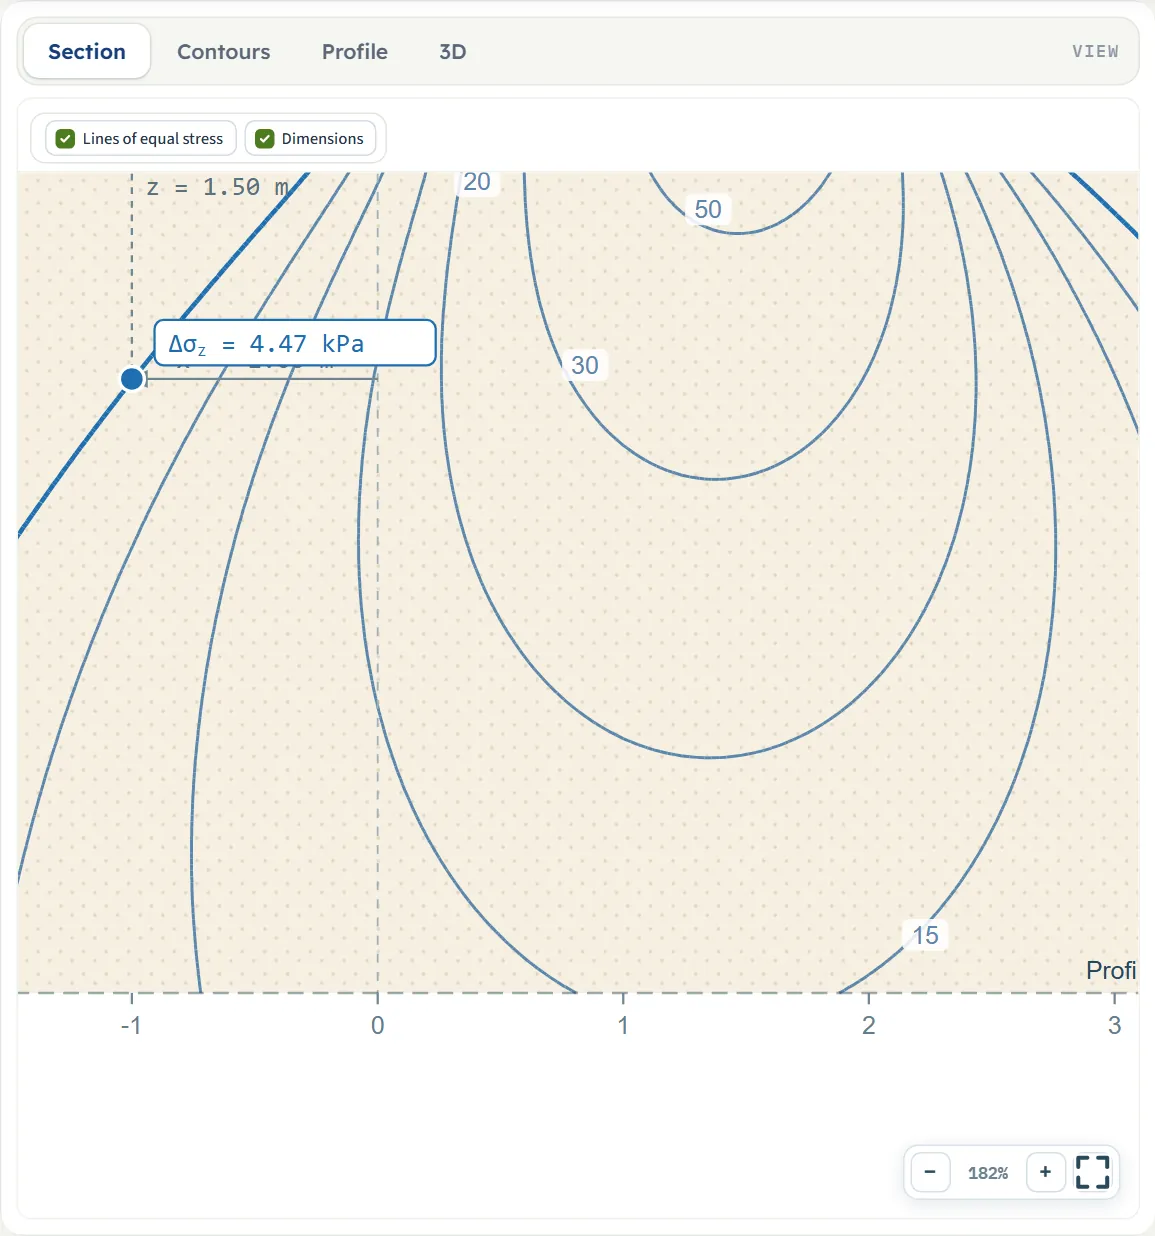
The − and + buttons (or the mouse wheel over the drawing) zoom; one press of + gives 135%. Once zoomed, drag the background to move the view; the square button fits the drawing again (100%).
Entering the model, section by section
The Model tab is a stack of four sections. Model data and Triangular strip loads are open when the module starts; Next in a section closes it and opens the next, Back goes the other way (Depth profile is the last section and has only Back). Units are shown in the order SI · kN, SI · tf, US, equal ones merged: for example kPa · t/m² · ksf. Defaults are in SI.
Model data
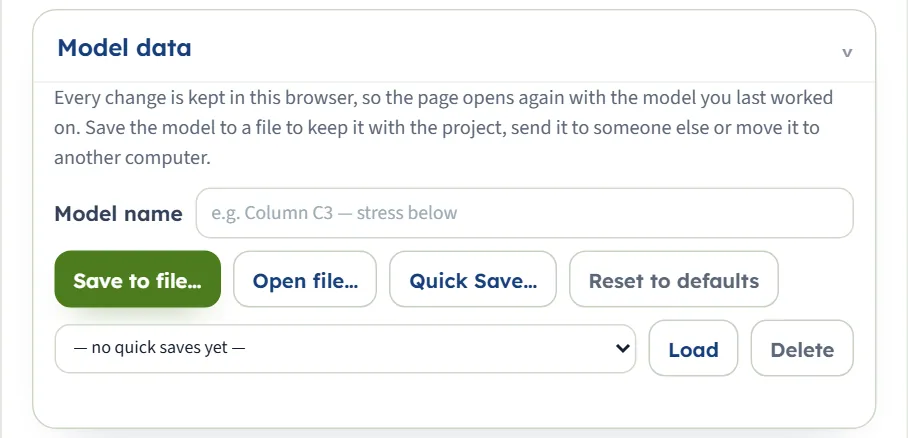
The first section keeps the model. Every change is kept in this browser: after a reload the page opens on the model you last worked on, with the same values (and, if you had pressed Analyze, still analysed). Save to file… and Open file… move a model to a file; Quick Save… asks for a name (it proposes the model name, or “Stress in soil” and the date) and keeps that version in the list, where Load brings it back and Delete (after a confirmation) removes it; Reset to defaults returns to the example at once, without a question, and says so below the list. Model name is a free label.
Triangular strip loads
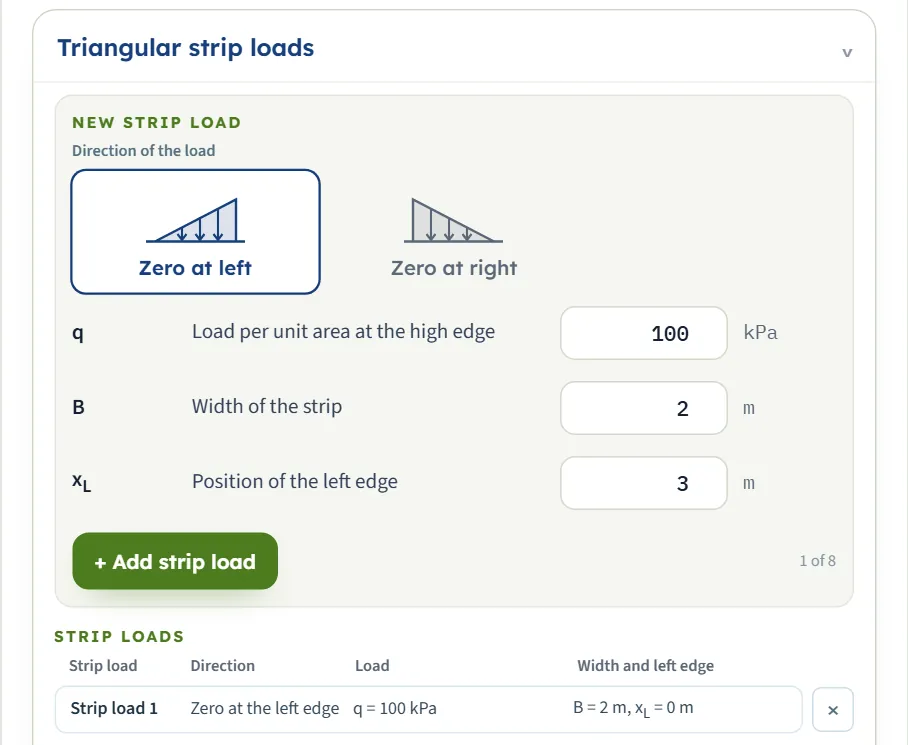
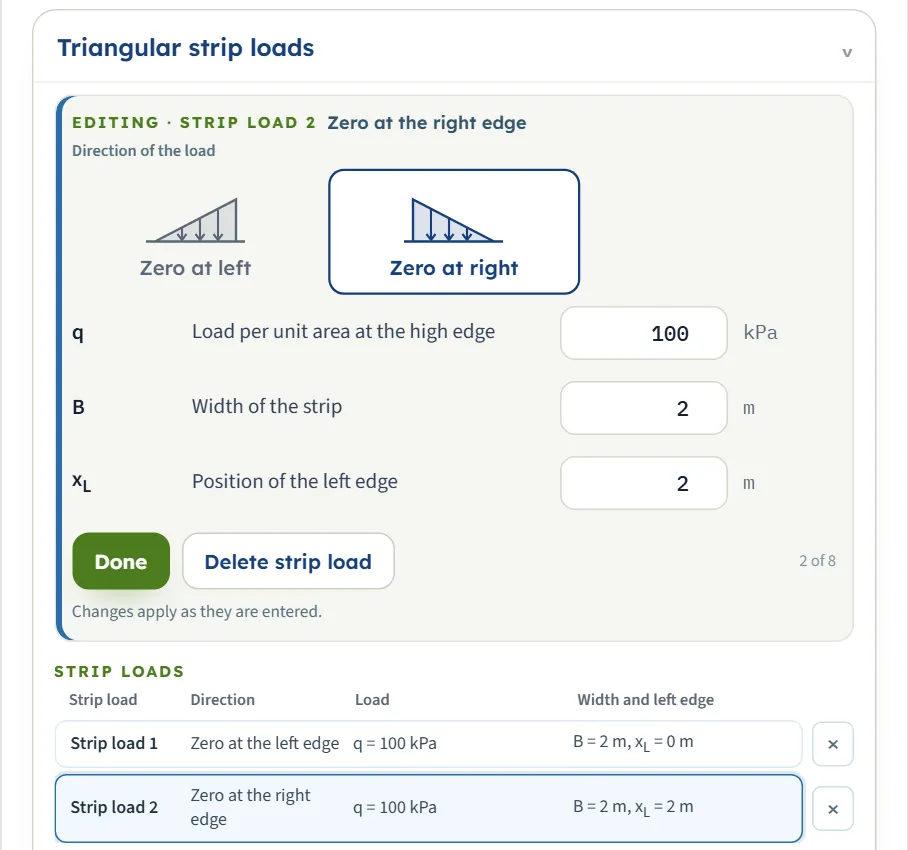
The section has a New strip load form on top and a table of Strip loads below it. In the form choose the direction with the two buttons, type the three values and press + Add strip load; the strip goes into the table, the form returns to its starting values and a counter reads “2 of 8”. Press a row of the table to edit that strip in the form (the title reads “Editing · Strip load 2” and “Changes apply as they are entered”); Done returns to the new-strip form; Delete strip load or the × at the end of a row removes a strip. The table keeps its columns Strip load, Direction, Load, and Width and left edge.
| Field | Unit, default, range |
|---|---|
| Direction of the load | choice · default Zero at left · Zero at left or Zero at right. The load is zero at that edge and rises to q at the other |
| Load per unit area at the high edge (q) | kPa · t/m² · ksf · default 100 (first strip and new form) · At least 0 |
| Width of the strip (B) | m · ft · default 2 (first strip and new form) · At least 0.001 m |
| Position of the left edge (xL) | m · ft · default 0 for the first strip, 3 in the new-strip form · Any value; negative to the left of 0 |
The new-strip form always starts at q = 100, B = 2 and xL = 3, whichever strips are already in the table. Strips are numbered in the order you add them; the numbers appear on the drawing as q1, q2 and in the working.
Overlap
Two strips may meet at an edge (one ends at x = 2, the next begins at 2) but not overlap. The module refuses an overlapping strip at the moment you add it, when you type a value that would make two strips overlap (the value stays as it was) and when you drag one strip onto another. Each refusal is a short notice at the foot of the window.

Point A
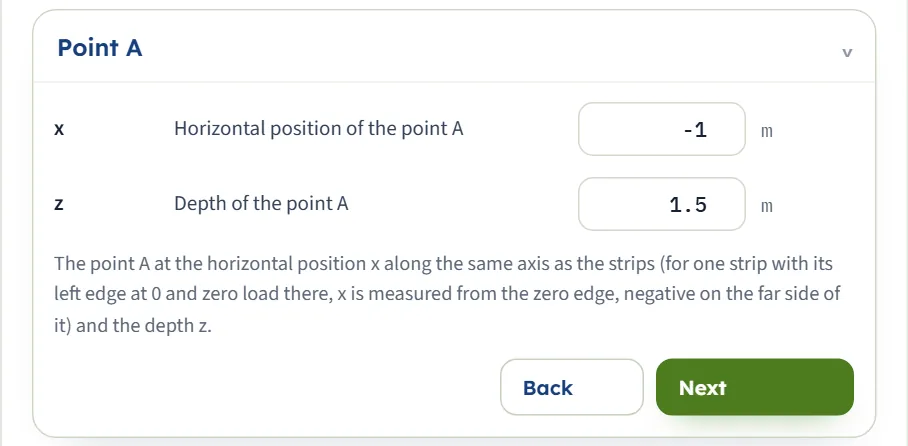
The point A where the stress is wanted. x is on the same axis as the strips; for one strip with its left edge at 0 and zero load there, x is measured from the zero edge, negative on the far side of it. The depth z is measured down from the surface.
| Field | Unit, default, range |
|---|---|
| Horizontal position of the point A (x) | m · ft · default −1 · Any value |
| Depth of the point A (z) | m · ft · default 1.5 · At least 0.001 m |
Depth profile
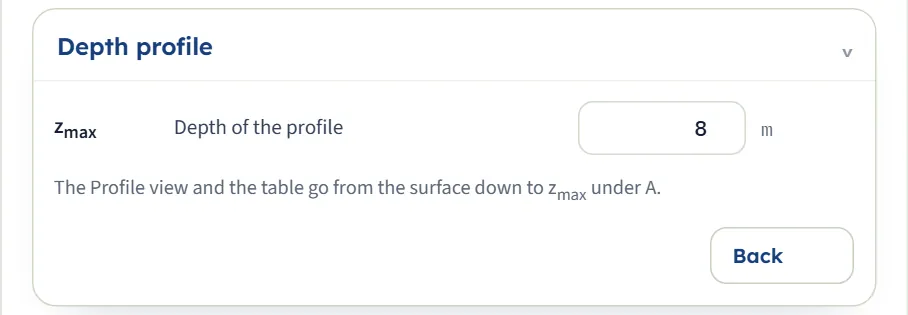
How deep the Profile view and the profile table go under A. The table has ten rows at equal steps down to zmax and the row of A itself. If zmax is smaller than z, the profile goes down to z instead.
| Field | Unit, default, range |
|---|---|
| Depth of the profile (zmax) | m · ft · default 8 · At least 0.1 m |
Choosing the direction and the axis
There is one real choice, the direction of each strip, and one convention, the axis along which xL and x are measured.
| Direction | The load | x of the equation |
|---|---|---|
| Zero at left | Zero at the left edge, q at the right edge | x = xA − xL: the distance of A from the left edge, positive to the right |
| Zero at right | Zero at the right edge, q at the left edge | x = xL + B − xA: the distance of A from the right edge, positive to the left |
The module works this out for you and writes it in the Calculations tab. A strip that is zero at its right edge is the mirror image of the other: the example strip with A at x = −1 m gives 4.470 kPa, and the same strip turned about (zero at right, left edge at 0, B = 2 m) gives 4.470 kPa for A at x = 3 m, which stands 1 m beyond the zero edge on the other side.
Building a load from strips
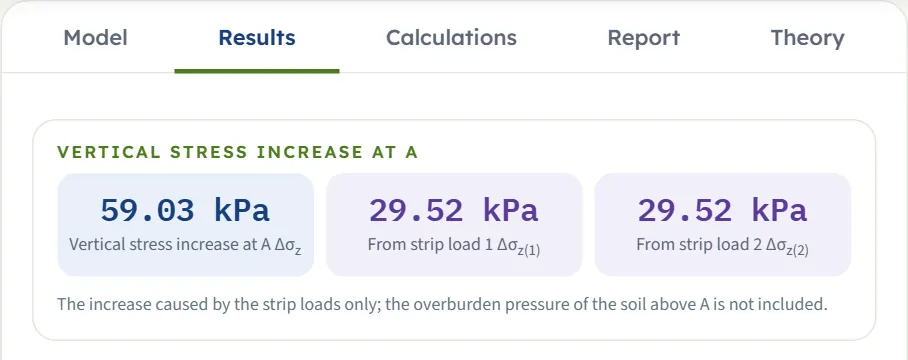
Two triangles side by side make a roof: strip 1 zero at left over 0 to 2 m and strip 2 zero at right over 2 to 4 m (both q = 100 kPa), a load that peaks at 100 kPa over x = 2 m. A at x = 2 m, z = 1.5 m gives 59.03 kPa, each strip contributing 29.52 kPa. Strips that carry the same load in the same direction in a row make a sawtooth. The module adds whatever you describe; the strips do not have to be the same size or touch.
Analyze and read the results
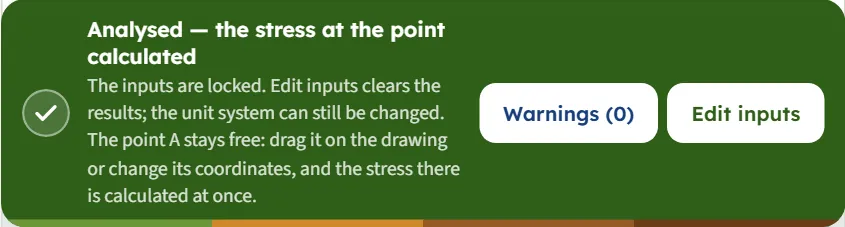
Press Analyze. The bar changes to Analysed — the stress at the point calculated and says “The inputs are locked. Edit inputs clears the results; the unit system can still be changed. The point A stays free: drag it on the drawing or change its coordinates, and the stress there is calculated at once.” Edit inputs unlocks the model. The Warnings (0) button beside it reports no warnings for the runs described here. The module stays on the Model tab; the answer is on Results.
| Card | Symbol | The example |
|---|---|---|
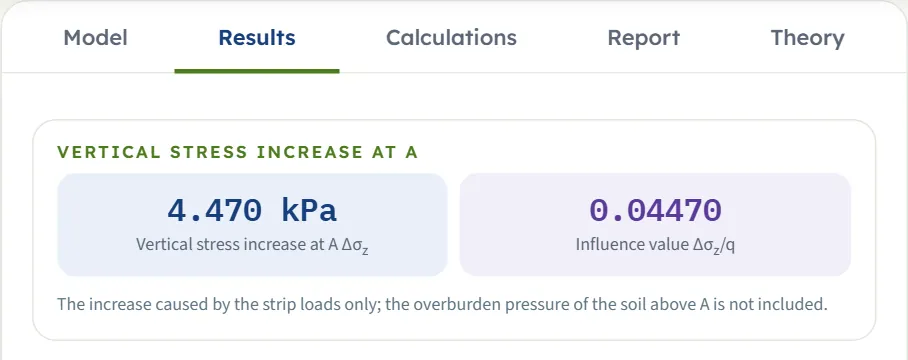
| Vertical stress increase at A | Δσz | 4.470 kPa |
| Influence value (one strip only) | Δσz/q | 0.04470 |
The cards are followed by a table of the values step by step and by Vertical stress increase under A: a table of z, Δσz and (for one strip) Δσz/q, with the row of A marked. In the example the profile runs 0.8 m: 1.334 kPa, 1.5 m (A): 4.470 kPa, 1.6 m: 4.905 kPa, 4.0 m: 8.936 kPa and 8.0 m: 6.734 kPa.
Several strips
With two or three strips the Results tab has a card for each strip, From strip load 1, From strip load 2, next to the total; with more strips only the total card is shown, and the working lists every strip. The influence value Δσz/q is given for one strip only, and the profile table has no such column for several.
Moving A after Analyze
Change x or z in the Point A section, or drag A, and the results, the lines and the profile follow without pressing Analyze again; the strips stay locked. The unit system can be changed at any time. The boxes, the Results tab, the Calculations tab and the profile table are stated in the new units; the drawings and the strip table keep SI symbols and values, so read the converted values in the boxes and on the Results tab.
Using the numbers
- Δσz is the increase of vertical stress caused by the strips, in the units of q. The module notes that the overburden pressure of the soil above A is not included.
- Δσz/q is the influence value for one strip: multiply any q by it for the same geometry. In the example it is 0.04470 for x/B and z/B of −0.5 and 0.75.
- The load is zero at one edge, so the strip’s total load per metre of length is qB/2.
- Δσz is vertical stress only; combine it with the settlement or bearing check you need.
The Calculations tab, the report and the Theory tab
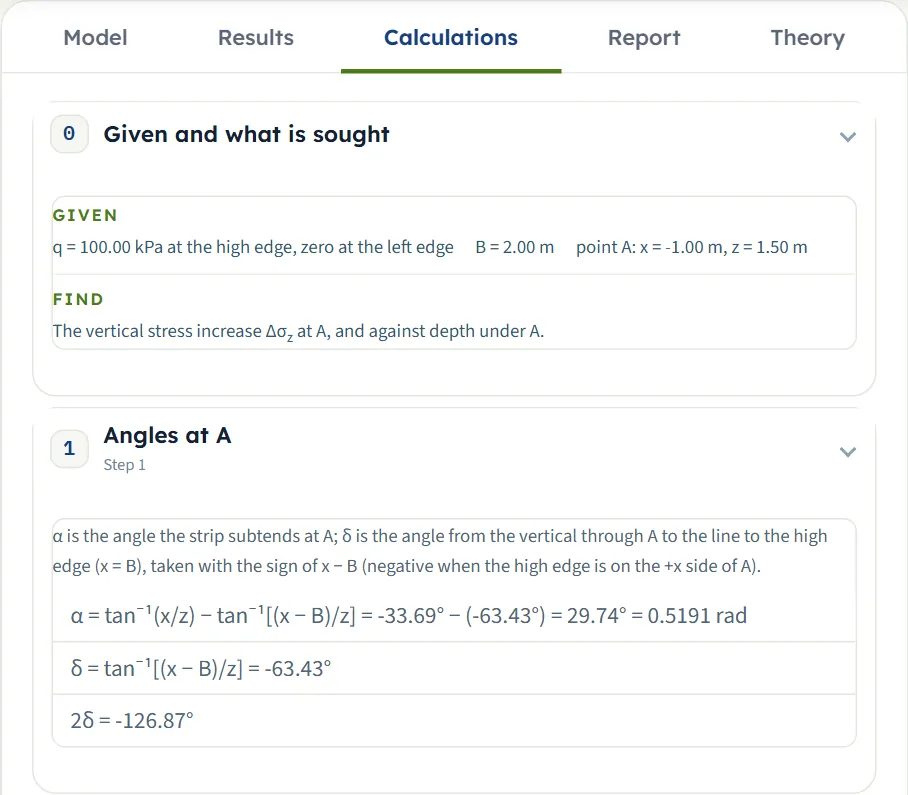
The Calculations tab opens with Given and what is sought and then writes out the working in numbered steps. For one strip there are three:
- Angles at A — α = tan⁻¹(x/z) − tan⁻¹[(x − B)/z] and δ = tan⁻¹[(x − B)/z], in degrees, with 2δ. For a strip with its left edge away from 0, or zero at right, the step first says how x is found.
- Stress at A — the equation, 2x/B and 2z/B, then Δσz/q with the numbers put in and Δσz.
- Stress increase against depth — zmax and the table under A, the row of A marked.
With several strips each strip has a step of its own (Stress from strip load 1, …) with its angles and its share, followed by a step Superposition that adds them, and then the profile.
The report
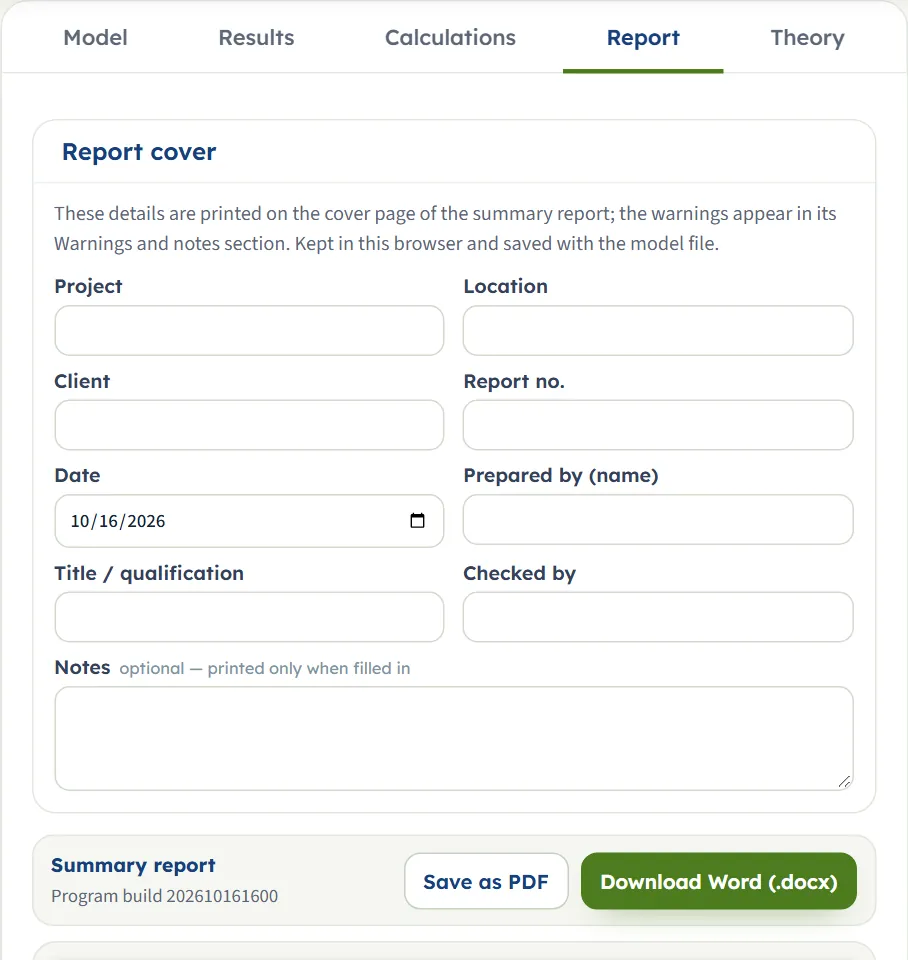
In the Report tab fill in the cover: project, location, client, report no., date, prepared by, title / qualification, checked by, and optional notes. The cover details are kept in this browser and saved with the model file. Save as PDF and Download Word (.docx) produce the report; the preview below the buttons is the report itself.
The report has six parts: 1 Introduction and scope, 2 Input data, 3 Calculation, 4 Results, 5 Summary and 6 References. It carries three drawings (the Section with the lines of equal stress, the Profile and the 3D view), the working of every step and the warnings, if any. Before Analyze the tab says “Press Analyze on the Model tab to calculate the stress at the point. The cover entered above is kept.”
The Theory tab
The Theory tab has five sections, each opening on a click (with Open all and Close all): Scope and assumptions; Derivation; Chart and table (a chart of Δσz/q against 2x/B for several depths and a table of its values); Worked example; References.
Worked example: the module’s own example
The module opens on this example, so you can follow the numbers on your own screen.
| Section | Input | Value |
|---|---|---|
| Triangular strip loads | Direction | Zero at the left edge |
| q, B, xL | 100 kPa, 2 m, 0 | |
| Point A | x, z | −1 m, 1.5 m |
| Depth profile | zmax | 8 m |
Step 1: the angles
x = −1 m is measured from the zero edge (the left edge), so x/z = −0.667 and (x − B)/z = −2. α = tan⁻¹(−0.667) − tan⁻¹(−2) = −33.69° + 63.43° = 29.74° = 0.5191 rad, and δ = tan⁻¹(−2) = −63.43°, so 2δ = −126.87°.
Step 2: the influence value
Step 3: the stress
This is the number in the Results card, in step 2 of the Calculations tab and in the box beside A in the Section view. The largest value in the profile table is 8.936 kPa at 4 m; the answer at A (1.5 m) is the marked row.
The same strip in SI · tf
Switch to SI · tf. The module converts the model: q = 10.1972 t/m². The answer is Δσz = 0.4558 t/m², the same stress (Δσz/q is unchanged). By hand 4.470 / 9.80665 = 0.4558.
The same strip in US units
Switch to US: q = 2.08854 ksf, B = 6.56168 ft, x = −3.28084 ft, z = 4.92126 ft. The answer is Δσz = 0.09336 ksf; by hand 4.470 kPa / 47.8803 = 0.09336 ksf. The profile rows are in feet: 4.921 ft (A) gives 0.09336, 13.12 ft gives 0.1866.
A second strip
Press + Add strip load with the new-strip form as it stands (zero at left, q = 100, B = 2, xL = 3). The second strip stands 3 to 5 m and A is 4 m from its zero edge on the far side (x = −1 − 3 = −4): its share is 0.2454 kPa by hand, and the module gives a total of 4.715 kPa = 4.470 + 0.245.
How each input changes the answer
Each row changes one thing in the example (one strip, zero at left, q = 100 kPa, B = 2 m, left edge 0, A at x = −1 m, z = 1.5 m) and runs the module again. The numbers are the ones the module gives, and every row has been checked by hand with the equation above.
| Change | Δσz (kPa) | Δσz/q |
|---|---|---|
| The example The reference: q = 100, B = 2, left edge 0, zero at left, A at (x = −1, z = 1.5) | 4.470 | 0.04470 |
| q = 50 kPa | 2.235 | 0.04470 |
| q = 200 kPa The stress is proportional to q; Δσz/q is unchanged | 8.940 | 0.04470 |
| B = 1 m | 4.479 | 0.04479 |
| B = 4 m | 3.259 | 0.03259 |
| B = 8 m A is 1 m outside the zero edge of a wide strip | 1.908 | 0.01908 |
| Left edge at xL = 1 m A is now 2 m from the zero edge | 1.402 | 0.01402 |
| Left edge at xL = −3 m A stands at the high edge | 29.52 | 0.2952 |
| Zero at right A is now 1 m beyond the high edge | 10.10 | 0.1010 |
| Zero at right, A at x = 3 m The mirror of the example | 4.470 | 0.04470 |
| A at x = 0 (the zero edge) | 15.28 | 0.1528 |
| A at x = 1 m (under the middle) | 33.41 | 0.3341 |
| A at x = 2 m (the high edge) | 29.52 | 0.2952 |
| A at x = 3 m | 10.10 | 0.1010 |
| A at x = 5 m | 0.9701 | 0.009701 |
| A at x = −3 m | 0.5393 | 0.005393 |
| A at x = −5 m | 0.1263 | 0.001263 |
| A at z = 0.5 m | 0.4110 | 0.004110 |
| A at z = 3 m | 8.536 | 0.08536 |
| A at z = 6 m | 7.982 | 0.07982 |
| A at z = 20 m | 3.095 | 0.03095 |
| zmax = 4 m Only the table and the profile change | 4.470 | 0.04470 |
| A second strip (zero at left, 100 kPa, 2 m, left edge 3 m) No influence value for several strips | 4.715 | — |
| Second strip zero at right, left edge 2 m A at (−1, 1.5) | 5.440 | — |
What the table shows:
- The load acts in proportion: 50, 100 and 200 kPa give 2.235, 4.470 and 8.940 kPa.
- The position of A changes the answer by a large factor: from 0.1263 to 33.41 kPa across the strip at 1.5 m depth. Across the strip at 1.5 m depth the stress is 0.1263 kPa at x = −5 m, 4.470 at −1 m, 15.28 at the zero edge, 33.41 under the middle of the strip (x = 1 m, the largest of these runs), 29.52 at the high edge and 10.10 and 0.9701 kPa at 1 and 3 m beyond it.
- Depth first raises the stress under a point beside the strip and then lowers it: 0.4110, 4.470, 8.536, 7.982 and 3.095 kPa at 0.5, 1.5, 3, 6 and 20 m.
- The width changes the answer moderately for a point beside the strip: 4.479, 4.470, 3.259 and 1.908 kPa for B = 1, 2, 4 and 8 m with the same q.
- Direction and the left edge only change where the zero and the high edge are: the strip turned about, with A at the mirror place, gives the same stress.
- Further strips add their share; zmax changes only what is shown of the profile.
Messages: when the module stops, and cautions
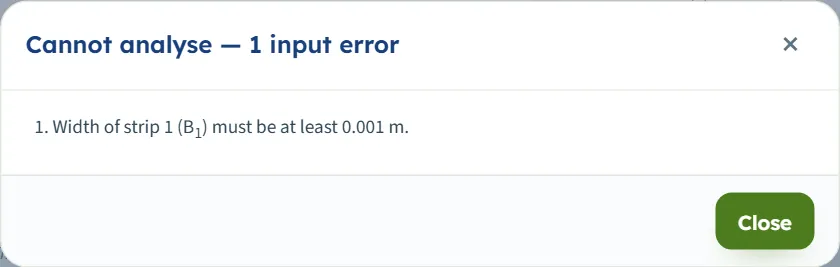
The module checks its inputs before it calculates. A problem stops the analysis and nothing is calculated: a window titled Cannot analyse — 1 input error (or “n input errors”) lists each one, and a value below its limit is also marked in red before you press Analyze.
| When | The message |
|---|---|
| q empty | “Load per unit area of strip 1 at its high edge (q1) is missing.” |
| q below 0 | “Load per unit area of strip 1 at its high edge (q1) must be at least 0 kPa.” |
| B 0 or negative | “Width of strip 1 (B1) must be at least 0.001 m.” |
| B empty | “Width of strip 1 (B1) is missing.” |
| z 0 or negative | “Depth of the point A (z) must be at least 0.001 m.” |
| z empty | “Depth of the point A (z) is missing.” |
| x empty | “Horizontal position of the point A (x) is missing.” |
| zmax 0 | “Depth of the profile (zmax) must be at least 0.1 m.” |
| zmax empty | “Depth of the profile (zmax) is missing.” |
Several errors are listed together; for strip 2 and on the names read q2, B2 and so on. After the stop the Results tab says “Press Analyze on the Model tab to calculate the stress at the point.”
Notices about the strips
- “The new strip load would lie on strip load 2 — they cannot overlap. Give it another position or width.” when you add a strip that overlaps another.
- “That would put strip load 1 and strip load 2 on top of one another — the value is kept as it was.” when a typed value or a drag would do so.
Two strips that only touch at an edge are accepted: with strip 2 at xL = 2 m after strip 1 (0 to 2 m) the module gives 5.009 kPa for the example point, 47.97 kPa for A at x = 2 m, z = 1 m.
Cautions
With q = 0 the answer is 0 kPa, but the influence value cannot be formed (the card shows a dash and the Calculations tab prints NaN for it); use q > 0 for a working. The Warnings (0) button stays at 0 in the runs described here; if a warning appears the button reopens it and the report prints it.
Good practice and common mistakes
- q is the value at the high edge, not the average: the average over the strip is q/2.
- Check the direction. Zero at left and zero at right differ only by a mirror image; a wrong choice puts the heavy edge on the wrong side of A. Look at the drawing before Analyze.
- Choose one axis for all strips and for A. xL and x are on the same axis; the drawing labels x − x1 when the first strip does not sit at 0.
- Strips may touch, not overlap. For a load that is a trapezoid, a roof or a sawtooth, use several strips side by side.
- Read the profile as well as the number. Beside a strip the stress grows with depth first and then falls; a single point can hide that.
- Add the overburden yourself. The module gives the increase only.
- Use the lines or the colours to find where the stress matters. Drag A over the Section or Contours view and read the box.
- After a unit change read the answer from the Results tab; the boxes show the converted values with more decimals.
- Your typed values are kept in the browser; save the model to a file to keep it with the project, and use the report as the record of the analysis.
Frequently asked questions
What does the Triangular strip load module calculate?
The vertical stress increase Δσz below one or several flexible strip loads of infinite length whose load rises linearly from zero at one edge to q at the other, for an elastic half-space in plane strain. For the example it gives Δσz = 4.470 kPa (Δσz/q = 0.04470).
What is q?
The load per unit area at the high edge of the strip, the edge that is not zero. The average load over the width is half of it.
How do I put the zero at the right edge?
In the New strip load form (or when editing a strip) choose Zero at right. The strip is then the mirror image: the module measures x from the right edge toward the left.
Can the point A be beside the strip, or under it?
Both. x can be any value on the axis; the equation holds for every position, beside, under or beyond the strip. Depth z must be at least 0.001 m.
How many strips can I use?
Up to eight. Each has its own q, B, xL and direction. They may meet at an edge but not overlap, and their stresses add.
What happens if two strips overlap?
The module refuses: when you add the strip, type the value or drag it, a notice appears and the value is kept as it was. A pull stops where the strips touch.
Can I drag things on the drawing?
Yes. Before Analyze you can drag a strip, and the rings at its edges to change its width, in the Section and 3D views (5 cm steps, width at least 0.1 m). The point A and the dashed profile-depth line can be dragged before and after Analyze; after Analyze the stress at A is recalculated at once.
Does the result include the weight of the soil?
No. The module gives the increase caused by the strips only; the overburden pressure of the soil above A is not included.
What do the lines of equal stress and the colours show?
The same field of Δσz in the vertical plane through A: lines for 4.5, 7, 10, 15, 20, 30 and 50 kPa in the example in the Section view, colour bands on a logarithmic scale in the Contours view. The blue line is the value at A.
What is the depth of the profile for?
It sets how far down the Profile view and the table under A go. It does not change the stress at A. If it is smaller than z, the profile goes down to z.
Does the module remember my inputs?
Yes. Every change is kept in this browser, and the module reopens on the model you last worked on (analysed again if it was analysed). Reset to defaults returns to the example; Save to file and Quick Save keep versions.
What units does it use, and what does the report contain?
SI · kN, SI · tf or US, switchable at any time, even after Analyze (stress in kPa, t/m² or ksf; lengths in m or ft). The boxes and the tabs follow; the drawings and the strip table keep SI symbols and values. The report has a cover and six parts, with the Section, Profile and 3D drawings and the working of every step, as a PDF or a Word file after Analyze.