

What the module calculates
Influence chart gives the increase in vertical stress at a point of the ground below, or beside, a flexible area of any polygonal shape that carries a uniform pressure q on the ground surface. The ground is taken as a homogeneous, isotropic, elastic half-space (Boussinesq). You enter the corners of the area in plan and the point A with its depth z; the module draws the area on Newmark’s chart at the right scale, shades the elements of the chart that the load covers, and gives Δσz at A, the lines of equal stress, the profile with depth under A and a 3D view.
Newmark’s chart (1942) is built from the stress below the centre of a uniformly loaded circle. Turned around, that solution gives the radius R of the circle that produces a chosen ratio Δσz/q:
Circles with these radii for Δσz/q = 0.1, 0.2 … 0.9, cut by 20 radial lines, make 200 elements, each of which, loaded alone, gives the same share IV = 1/200 = 0.005 of q at the depth z below the centre. The plan of the loaded area is drawn at the scale in which the depth z is the unit length AB of the chart, with the point A over the centre. If the area covers M elements:
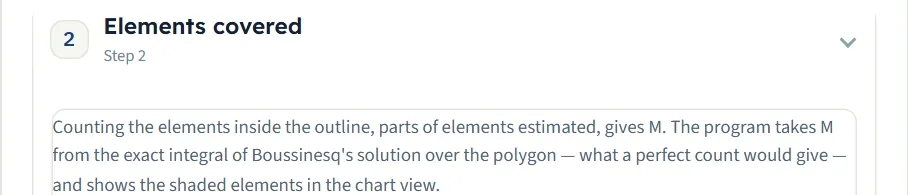
The module takes M from the exact integral of Boussinesq’s solution over the polygon, which is what a perfect count of the elements would give, and shows beside it the count read from the shaded chart.
What you can describe
- One uniform pressure q on one loaded area of 3 to 6 corners, given in plan by their x and y in order around the area (clockwise or anticlockwise). The area may be convex or concave.
- The point A in plan, xA and yA, under the area or beside it, and its depth z below the loaded level.
- The depth of the profile zmax, down to which the Profile view and the table under A run.
The result is the increase caused by the load only; the overburden pressure of the soil above A is not included, so add it where your design needs the total stress. The module draws the chart, the section with the lines of equal stress, the profile and a 3D view, writes out the working and prepares a PDF or Word report.
Which module for which load
- A load of any shape in plan, one pressure: this module. A rectangle with the corner method and several loads added together: Rectangle; a circle: Circle, any point.
- A long band: Vertical strip load; a trapezoidal fill with sloping sides: Embankment.
- A concentrated load: Point load.
- Layered ground with thin stiff seams: Westergaard point load or Westergaard areas.
- The module takes one area with one pressure. For several areas, add the stresses of separate runs, since the stresses of separate loads add on an elastic ground.
Before you start: what you need
Have these ready from your design:
| What | Notes |
|---|---|
| The load per unit area q | From your design loading. A pressure on a flexible area, zero or more; for a column footing, the column load divided by the footing area. |
| The corners of the area | From the plan of the footing, slab or fill. Three to six corners as x and y in one co-ordinate system, in order around the area. |
| The point A: xA, yA, z | Where you want the stress, in the same system; z is the depth below the loaded level, at least 0.001 m. |
Quick start in eight steps
- Open the module and choose the units
Open Influence chart from the Stresses in a Soil Mass family. Pick SI · kN, SI · tf or US in the header; you can change it at any time.
- Enter the load
In Load type the pressure q.
- Enter the loaded area
In Loaded area (plan) type the x and y of corners 1 to 3, and of corners 4 to 6 if the shape needs them. The Influence chart view shows the plan on the chart as you type.
- Place the point A
In Point A type xA, yA and z; or drag the blue point on the Section drawing (before or after Analyze).
- Set the depth of the profile
In Depth profile type zmax, or drag the dashed line at the foot of the Section drawing.
- Press Analyze
Press Analyze at the foot of the Model tab. The bar reads Analysed and the load and the corners lock; the point A and the profile depth stay free.
- Read the answer
The Results tab gives Δσz at A, the number of elements M and a table of the stress against depth under A. The Influence chart view shows the shaded elements; the lines of equal stress are on the Section drawing.
- Take the working and the report
The Calculations tab writes out the working; the Report tab saves a PDF or a Word file.
The screen: chart, section, profile and 3D
The layout is the one every GeoTerva module shares, described in the workspace guide. For this module the drawing has four views, chosen with the buttons above it:
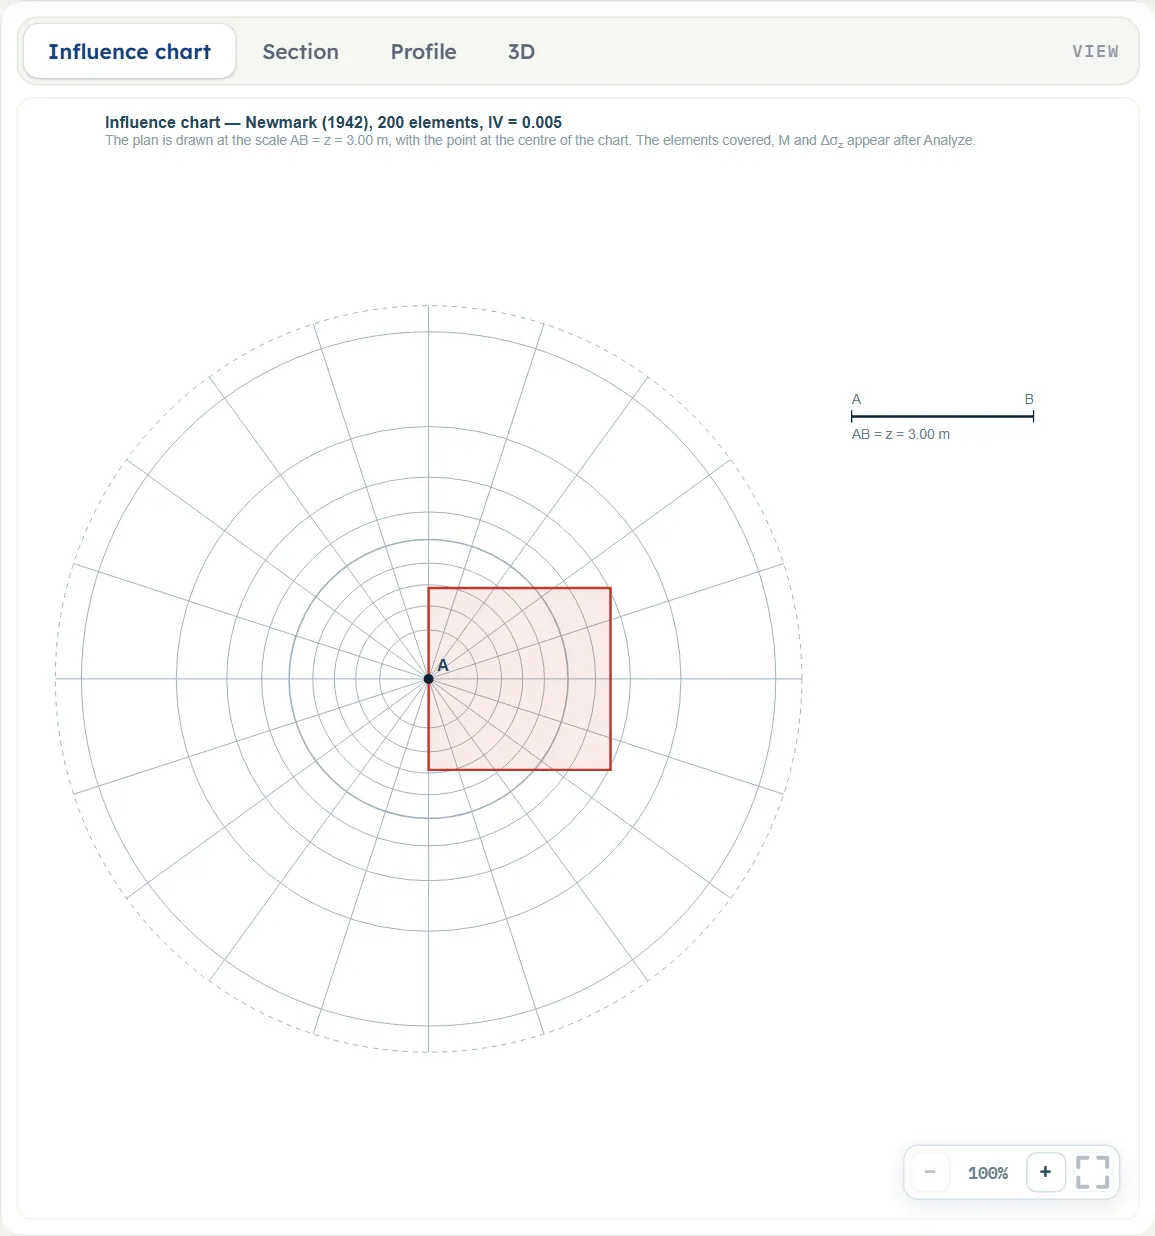
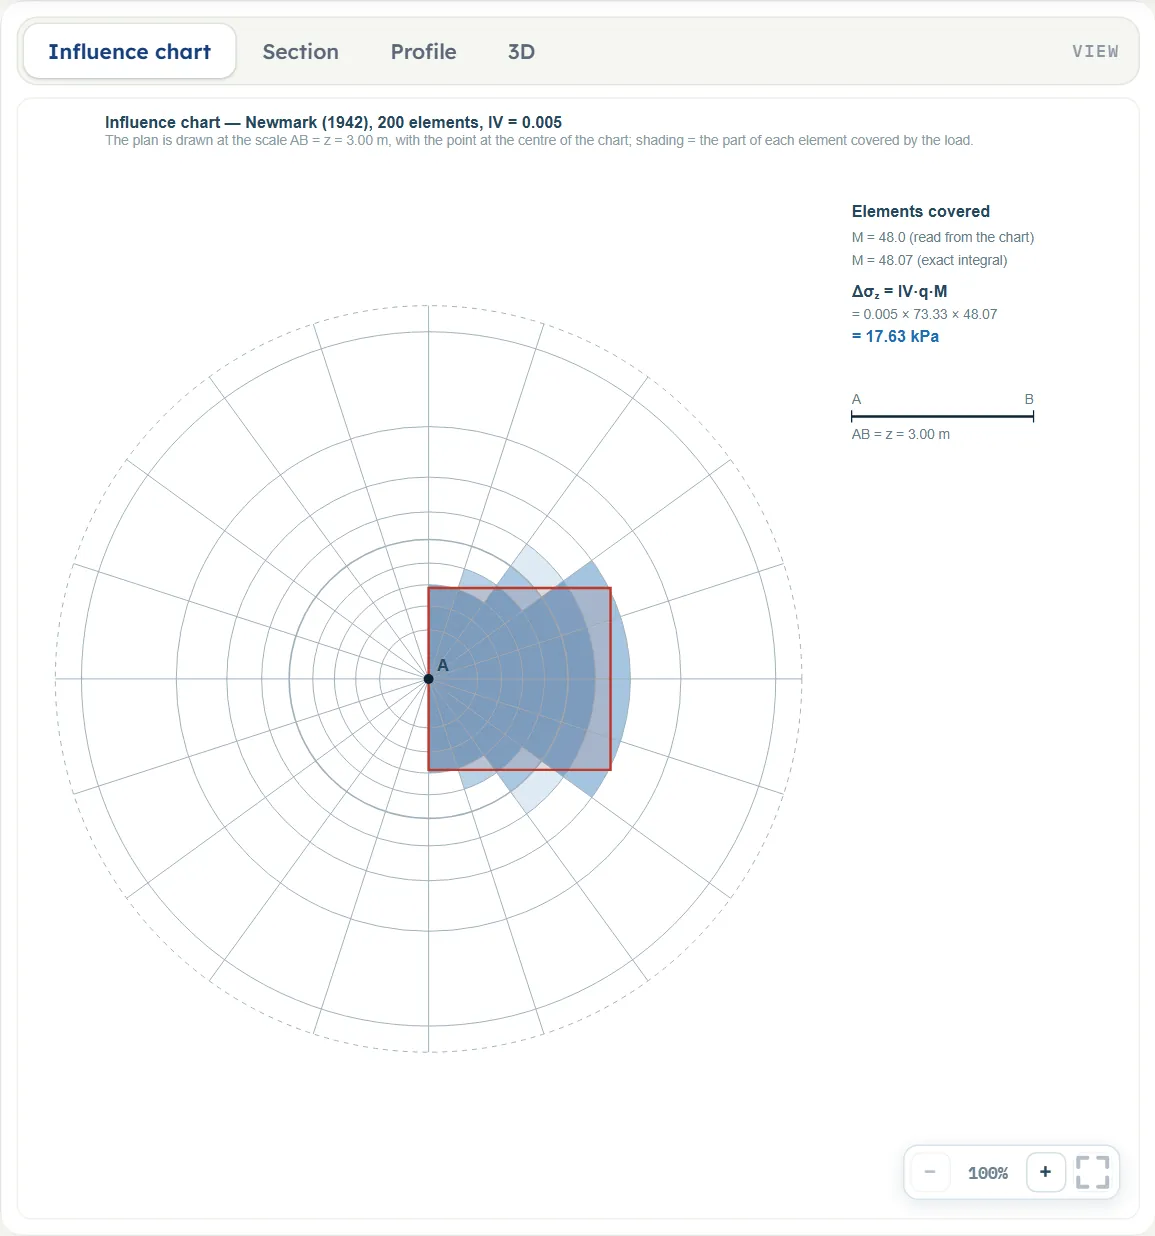
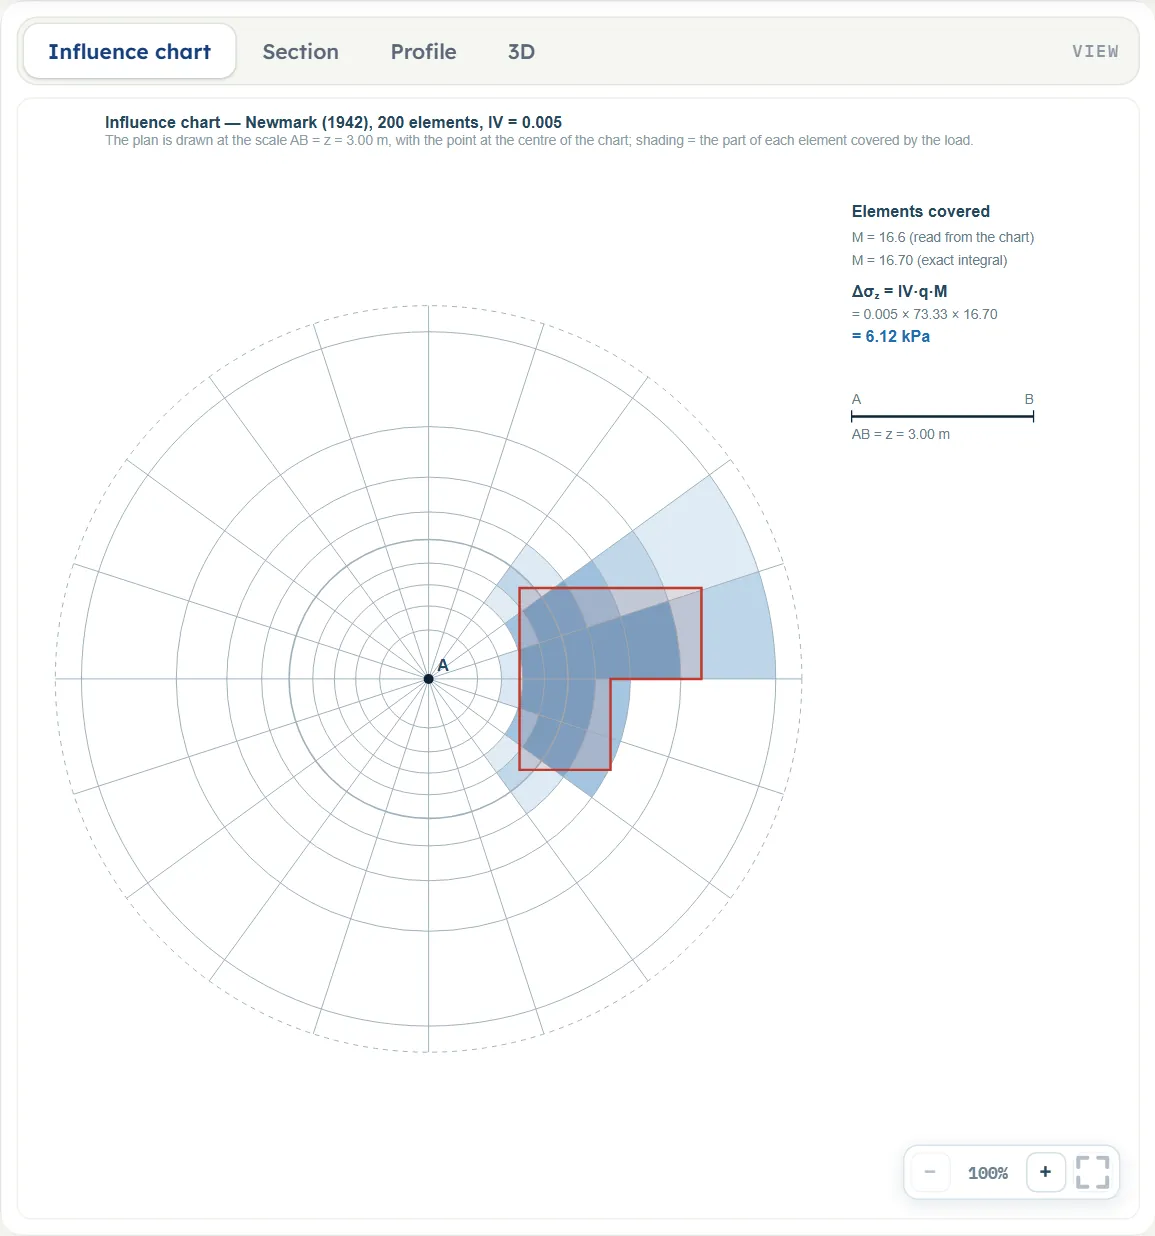
- Influence chart is Newmark’s chart, 200 elements, with the plan of the loaded area drawn at the scale AB = z and the point A at the centre. Before Analyze it shows the plan only; after it, the part of each element covered by the load is shaded, and a block at the right gives Elements covered, the two values of M and the working of Δσz.
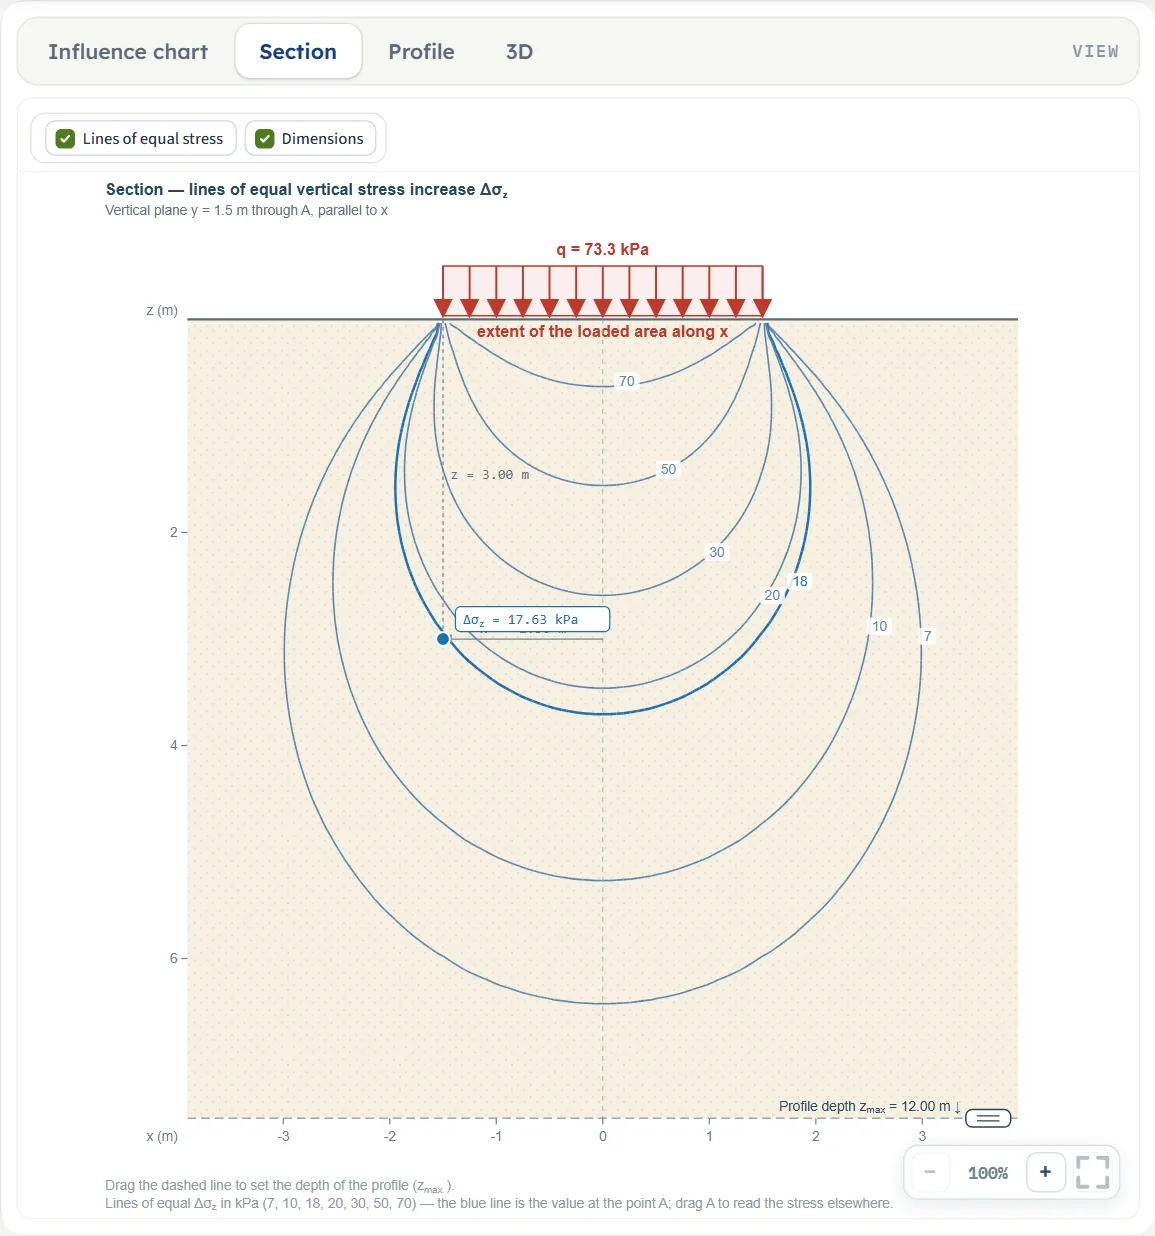
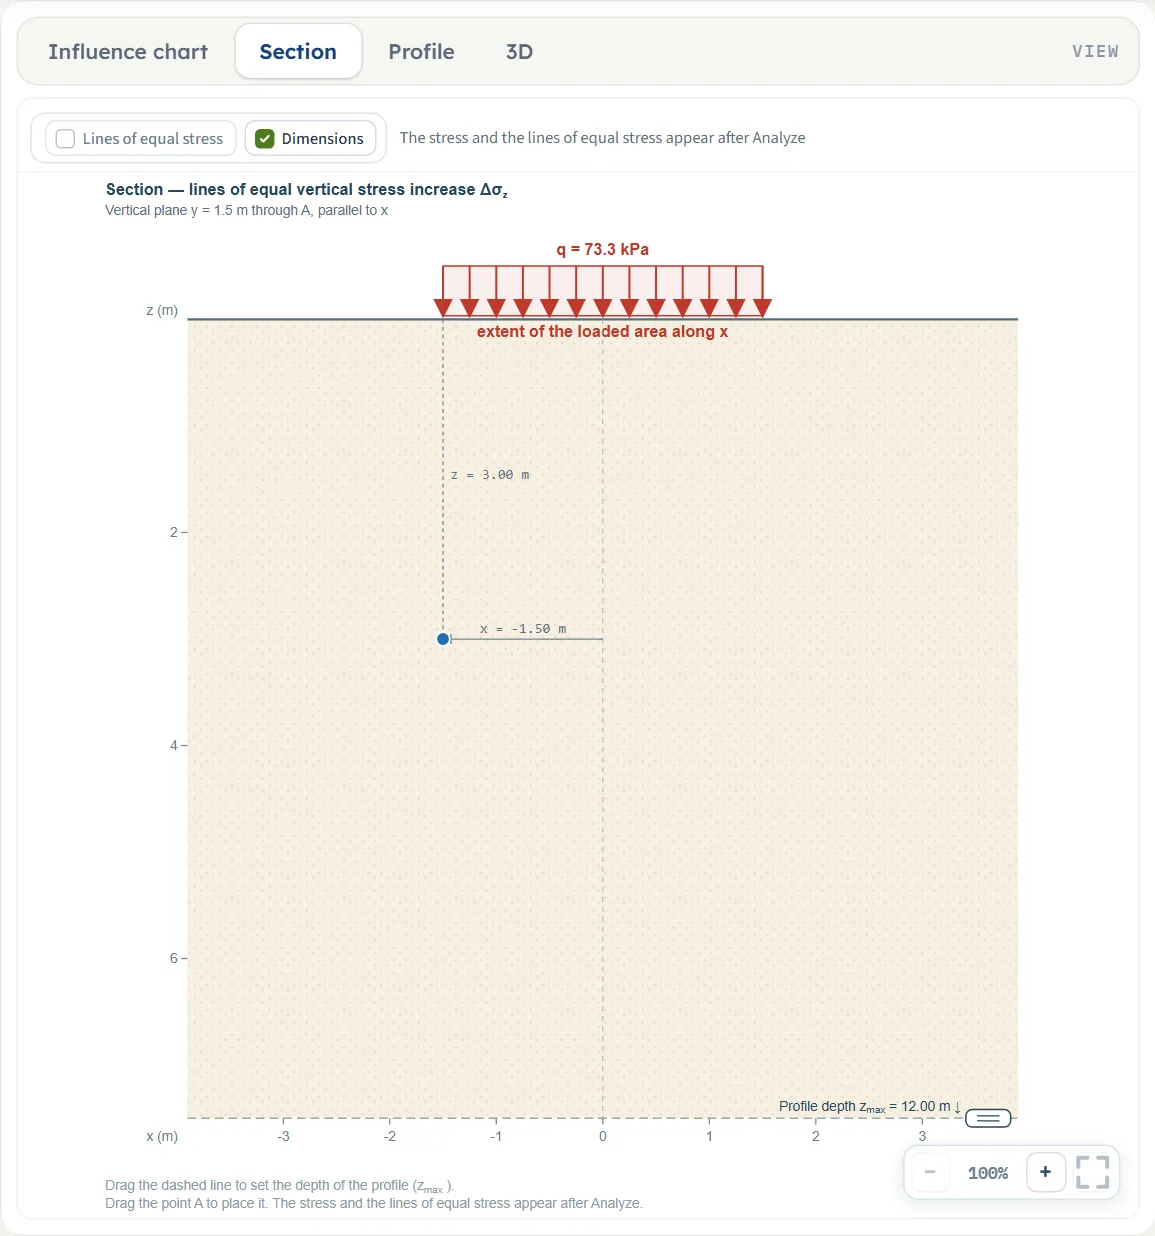
- Section is the vertical plane y = yA through A, parallel to x: the extent of the loaded area along x on the ground, the point A with the dimensions xA and z, and the dashed line of the profile depth. After Analyze it adds the lines of equal stress and a label with Δσz at A.
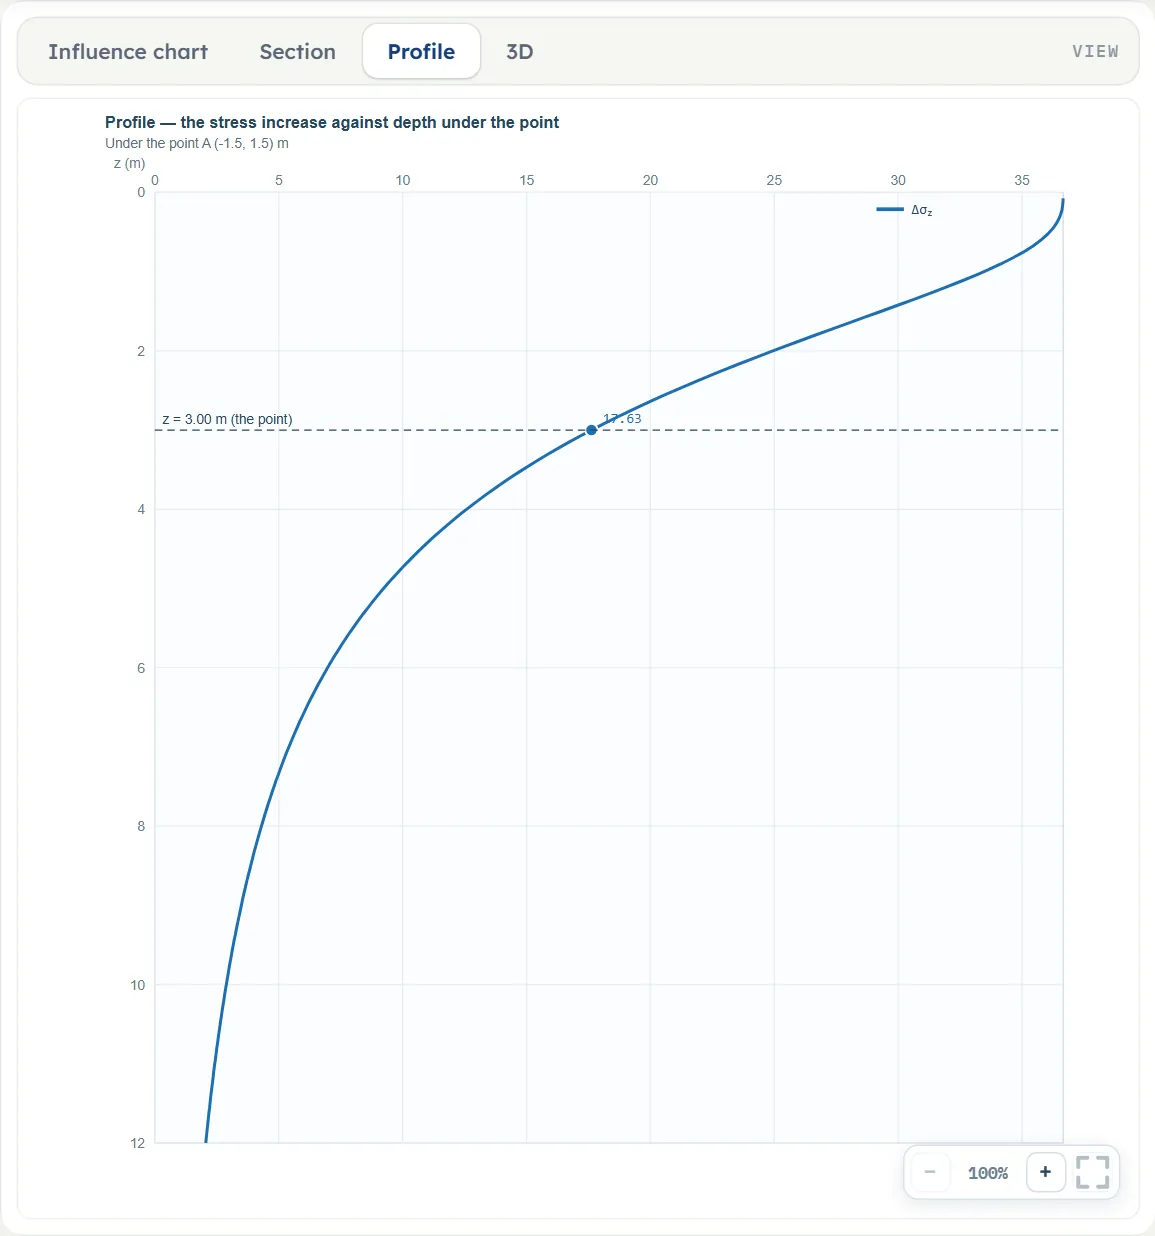
- Profile is the curve of Δσz against depth under A, with a marker and a dashed line at the depth of A.
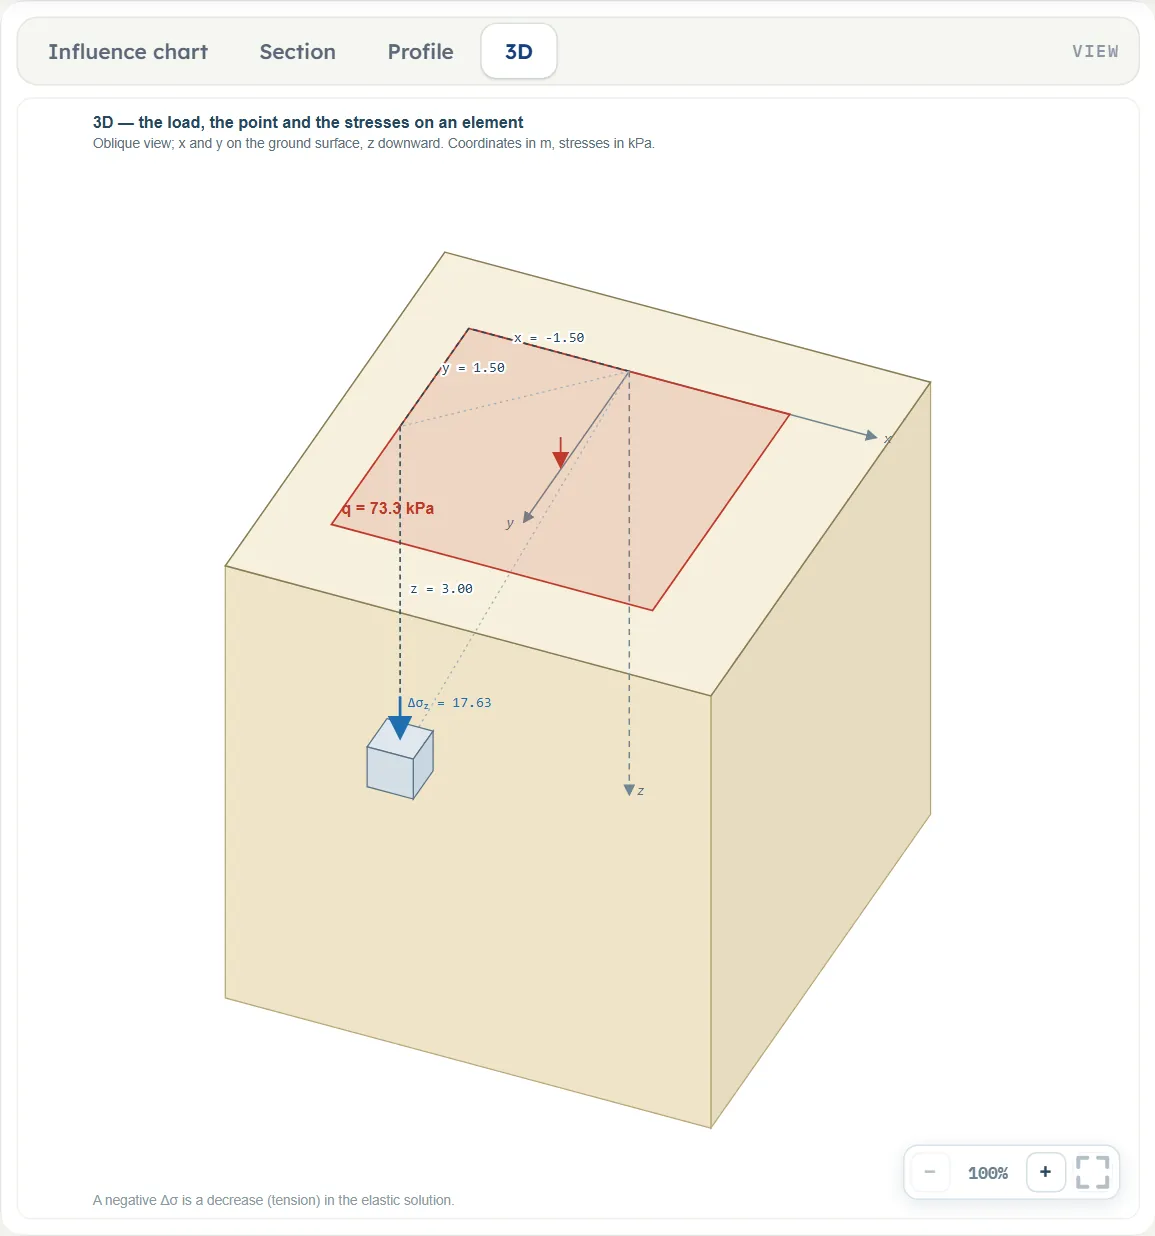
- 3D is an oblique view of the loaded area on the ground, the point A with its co-ordinates and an element at the depth z with the stress on it.
The Influence chart view follows the inputs: change a corner, z or the position of A and the plan moves on the chart at once. Before Analyze the Section view says “The stress and the lines of equal stress appear after Analyze”, the Profile view “The profile appears after Analyze” and the 3D view “The stresses on the element appear after Analyze”.
The Show chips
Above the Section drawing a bar has two chips: Lines of equal stress and Dimensions. The lines chip is off and greyed out until you press Analyze, and then turns on; Dimensions is on by default. The Influence chart, Profile and 3D views have no chips.
Dragging on the drawing
The loaded area is entered in the Model tab: the corners cannot be dragged. What can be dragged is on the Section drawing, whose hints read “Drag the point A to place it.” and “Drag the dashed line to set the depth of the profile (zmax).” What each pull does, as the module runs it:
- The point A. Drag the blue point: xA and z follow in steps of 5 cm (the boxes update as you pull) and yA stays as typed, because the section is the plane y = yA. The depth stops at 0.05 m at the top, and xA and z stop at the edges of the drawn frame. With the example, pulling A far to the upper left gives xA = −3.9 m and z = 0.05 m, and far to the lower right xA = 3.9 m and z = 7.5 m.
- The dashed line. Drag it up or down to set zmax; it stops at 0.5 m and has no upper limit.
- After Analyze the load and the corners are locked, but the point A and the dashed line stay free, and so do the boxes xA, yA, z and zmax: pull A and the stress there is calculated at once, and the lines of equal stress follow.
- Nothing else is dragged. The Influence chart, Profile and 3D views have no drag handles.
Zoom
Each view has −, a percentage and + at the lower right, and a button that fits the whole drawing in the pane. Zoom is a property of the drawing only: it is not saved with the model and does not change the report.
Entering the model, section by section
The Model tab has five sections: Model data, Load, Loaded area (plan), Point A and Depth profile. Each opens when you click its title; Next and Back at the foot walk you through them, and Analyze waits below the last one. Where a unit is shown twice or three times, such as m · ft, the units are those of SI · kN, SI · tf and US in turn, and equal ones are merged. Defaults are shown in SI; in US the boxes show the converted values, for example 3.13282 ksf for a pressure of 150 kPa, or −4.92126 ft for a corner at −1.5 m.
Model data
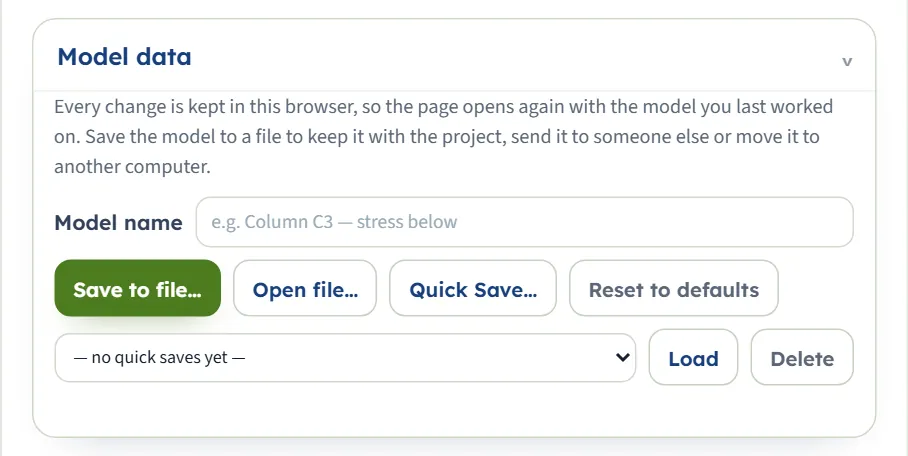
The first section holds the model name, Save to file…, Open file…, Quick Save… with its list and Load and Delete, and Reset to defaults. It works as described in the workspace guide. Reset returns the example at once.
Load
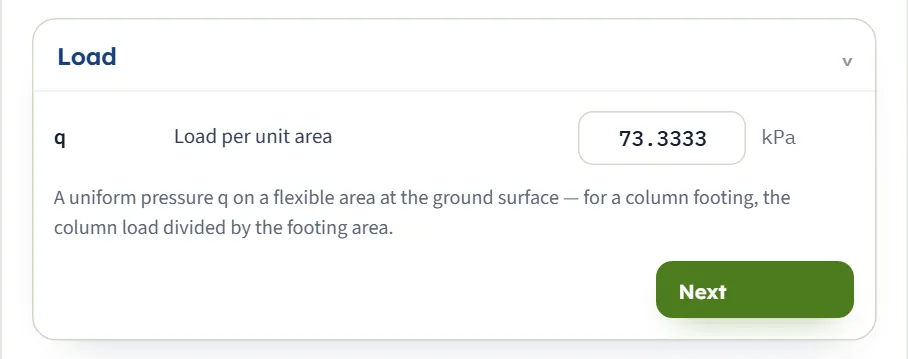
One number, the pressure q of the loaded area. The note in the section reads that it is a uniform pressure on a flexible area at the ground surface, and for a column footing the column load divided by the footing area. The example is 660 kN on 9 m², which the box shows as 73.3333.
| Field | What to enter |
|---|---|
| Load per unit area q kPa · t/m² · ksf · default 73.3333 | A uniform pressure on a flexible area at the ground surface; zero or more. |
Loaded area (plan)
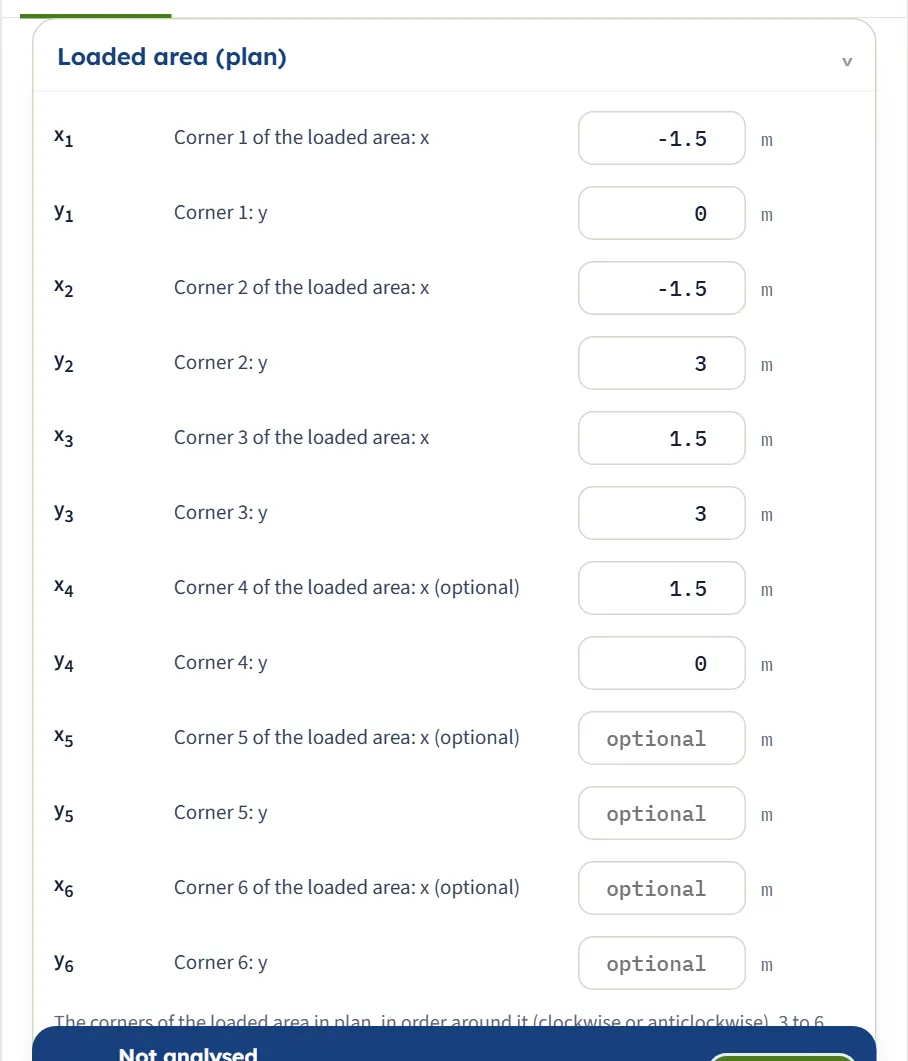
Six pairs of boxes, one pair for each possible corner. List the corners in order around the area, clockwise or anticlockwise; the result is the same either way. Corners 1 to 3 are required; corners 4 to 6 are optional, so leave them empty for a triangle, a quadrilateral or a pentagon. The area may be convex or concave. A corner counts only when both its x and its y are filled in: with one of the two empty the corner is left out, with no message, so look at the plan in the Influence chart view to see which corners the module has taken.
| Field | What to enter |
|---|---|
| Corner 1 of the loaded area: x x1 m · ft · default −1.5 | Corners 1, 2 and 3 are required. |
| Corner 1: y y1 m · ft · default 0 | |
| Corner 2: x and y x2, y2 m · ft · default −1.5 and 3 | |
| Corner 3: x and y x3, y3 m · ft · default 1.5 and 3 | |
| Corner 4: x and y x4, y4 m · ft · default 1.5 and 0 | Optional: the x labels of corners 4 to 6 say “(optional)” and empty boxes show “optional”. |
| Corner 5: x and y x5, y5 m · ft · default empty | Optional. |
| Corner 6: x and y x6, y6 m · ft · default empty | Optional. |
The point A is placed in the same co-ordinate system, so you may put the origin where you like: at a corner of the footing, at its centre, or at a point on the site plan.
Point A
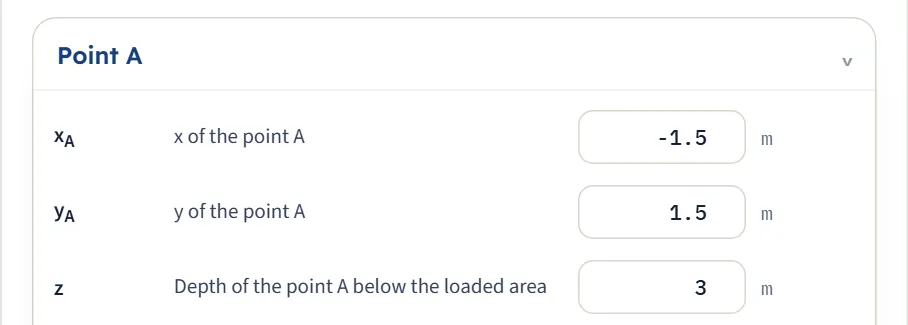
The three co-ordinates of the point where you want the stress: its position in plan and its depth below the loaded level. A can be under the area or beside it. The Section drawing shows xA and z as dimensions.
| Field | What to enter |
|---|---|
| x of the point A xA m · ft · default −1.5 | In plan, in the co-ordinate system of the corners. |
| y of the point A yA m · ft · default 1.5 | In plan. The Section view is the vertical plane through this value of y. |
| Depth of the point A below the loaded area z m · ft · default 3 | At least 0.001 m below the loaded level. |
Depth profile
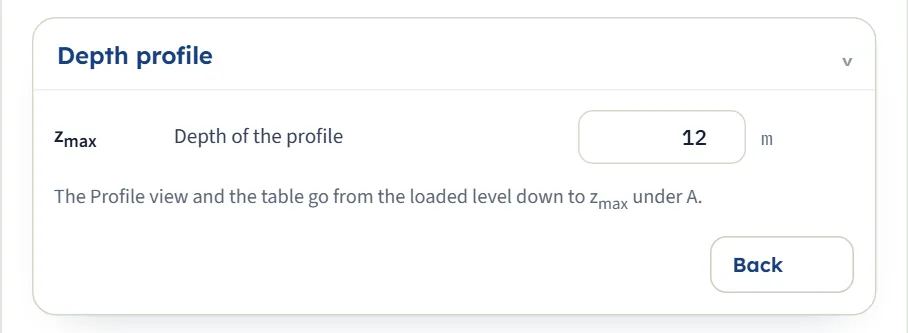
The depth down to which the Profile view and the table of the stress under A run.
| Field | What to enter |
|---|---|
| Depth of the profile zmax m · ft · default 12 | At least 0.1 m. The Profile view and the table under A go from the loaded level down to this depth, or to the depth of A if that is deeper; the Profile view runs a little past A. |
Choosing the shape and the point
The module has no options to pick: the choices are the shape of the area and the place of A. The stress depends on the plan of the area in units of z, so only the shape, the size relative to the depth and the position of A matter.
The shape of the area
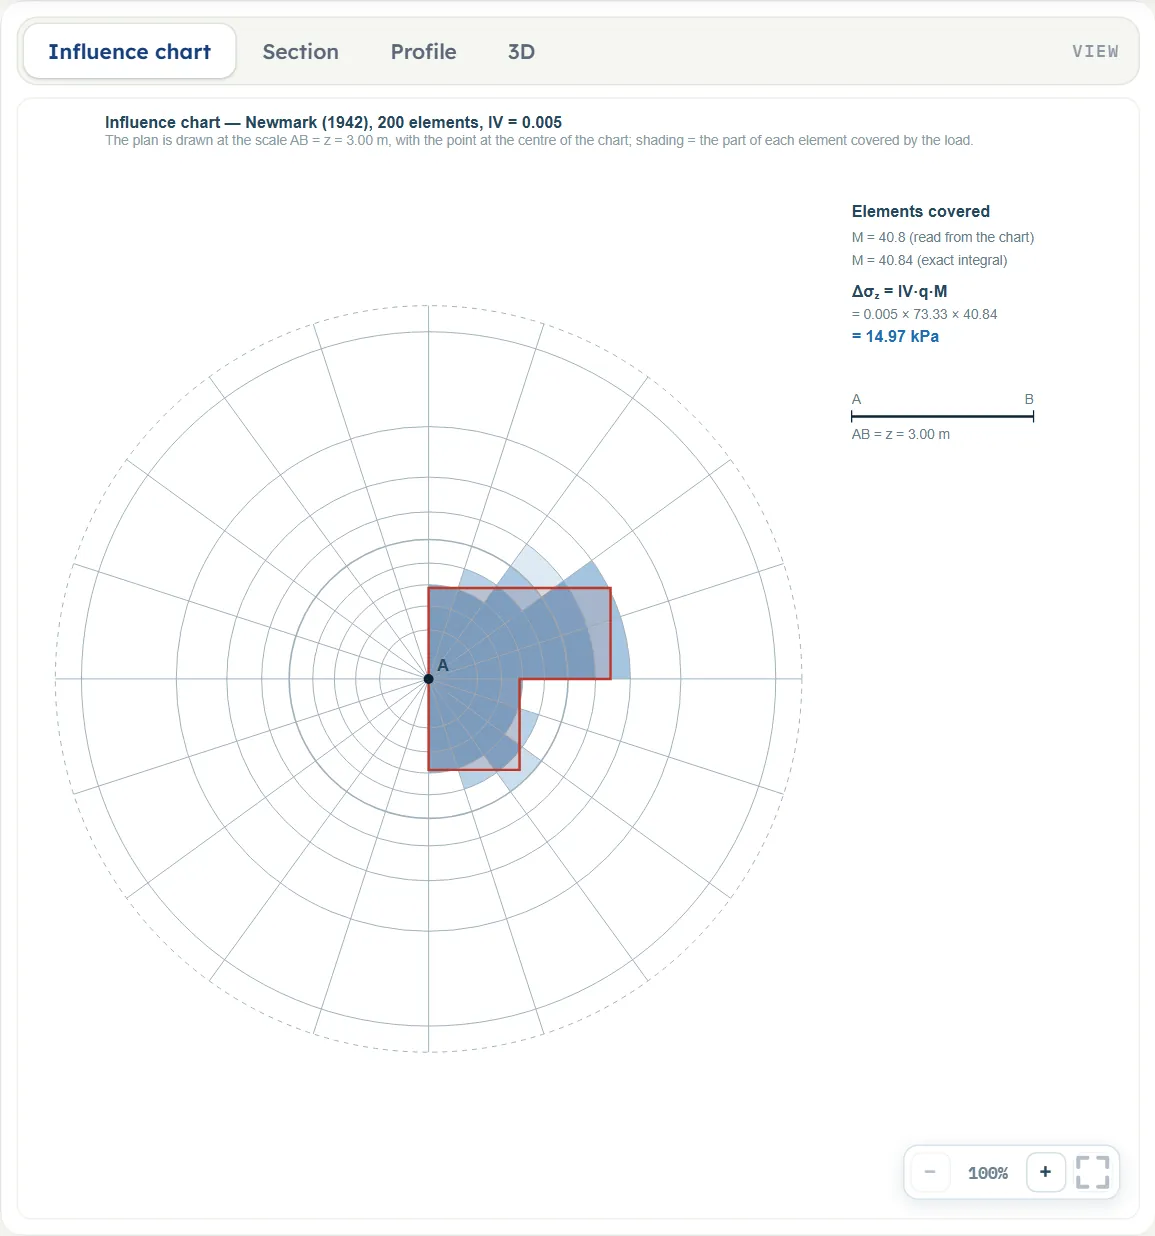
- Three corners give a triangle, four a quadrilateral, five and six a polygon with more sides. With the example point and depth, the triangle with corners (−1.5, 0), (−1.5, 3) and (1.5, 0) gives 11.27 kPa, the house shape of five corners (−1.5, 0), (−1.5, 3), (0, 4.5), (1.5, 3), (1.5, 0) gives 20.01 kPa, and an L shape of six corners, the square with the corner (0 to 1.5, 0 to 1.5) cut away, gives 14.97 kPa; the square gives 17.63 kPa.
- Concave shapes are accepted. The L shape above has a re-entrant corner and the chart shades only the elements that the load really covers.
- The order of the corners can run either way round: the square entered anticlockwise gives 17.63 kPa, as clockwise.
The place of A
- Under the area, the stress is high and falls with depth. Beside the area it is smaller and falls with distance: A at 1.5 m outside the edge of the example square gives 6.942 kPa, 4.5 m outside 0.7226 kPa.
- The Influence chart view shows where A is: it is the centre of the chart, and the plan sits off the centre when A is beside the area.
- Each depth has its own chart. The plan is drawn at AB = z, so changing z redraws the plan at another scale. The depth table of the Results tab gives the stress at ten depths, each with its own M.
Analyze and read the results
Press Analyze. The bar changes to Analysed — the stress at the point calculated and says “The inputs are locked. Edit inputs clears the results; the unit system can still be changed. The point A stays free: drag it on the drawing or change its coordinates, and the stress there is calculated at once.” A message appears briefly, “Analysed — see the Results tab and the Calculations.” The module stays on the Model tab: open Results for the answer.
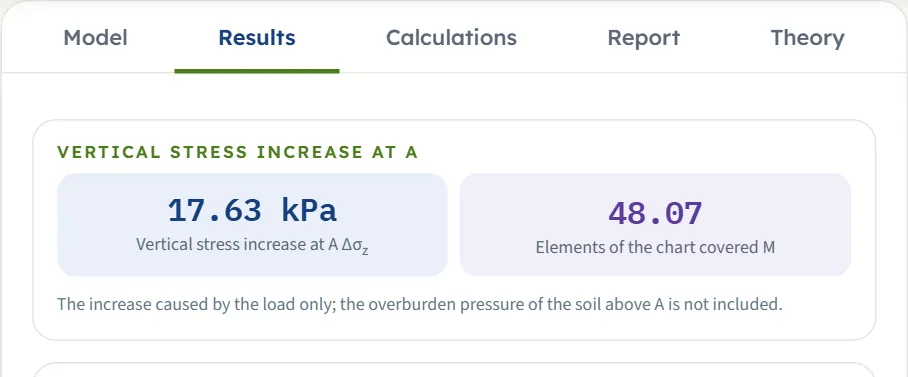
| Card | Symbol | The example |
|---|---|---|
| Vertical stress increase at A | Δσz | 17.63 kPa |
| Elements of the chart covered | M | 48.07 |
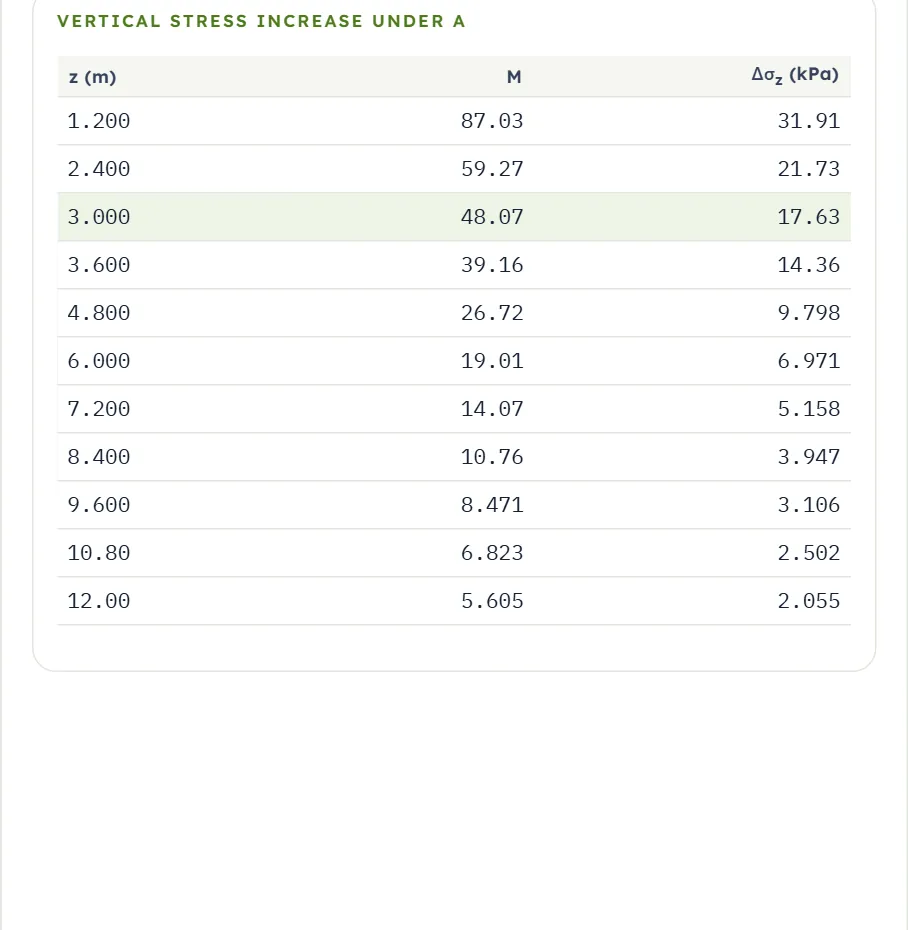
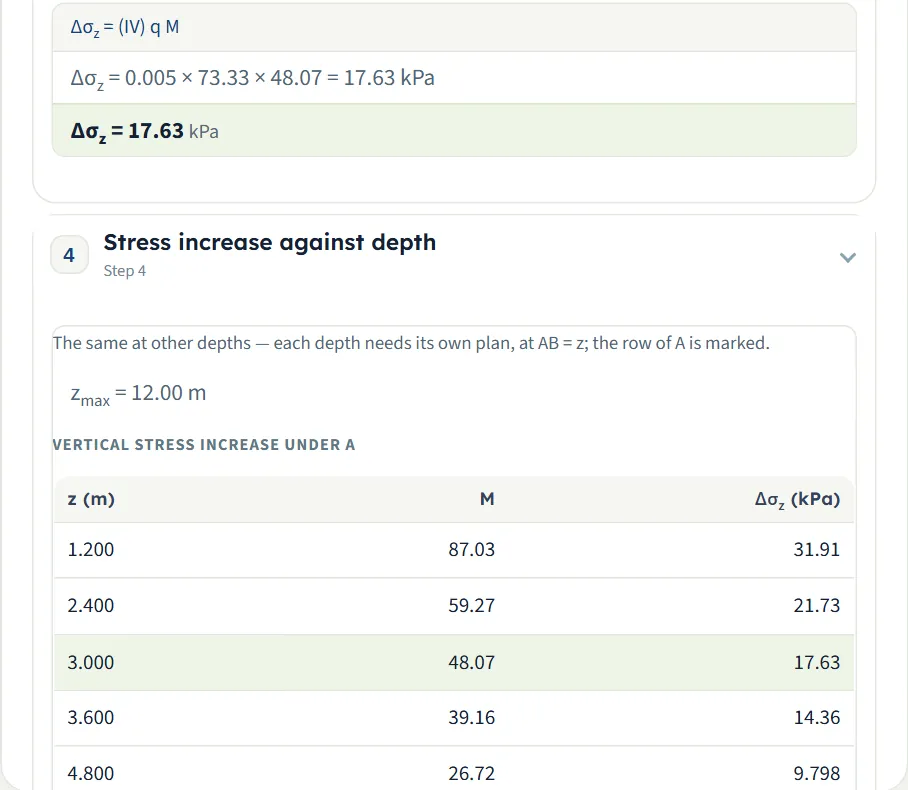
Below the cards a Values, step by step table gives the result of the step that ends in a stress, and the Vertical stress increase under A table gives z, M and Δσz at ten equal steps from the loaded level down to zmax, with the row of A inserted and highlighted. In the example the depths are 1.2, 2.4, 3.0 (A), 3.6 … 12 m, and the stress falls from 31.91 kPa at 1.2 m to 2.055 kPa at 12 m.
Reading the chart view
After Analyze the Influence chart view shows Elements covered with two values of M: “M = 48.0 (read from the chart)” and “M = 48.07 (exact integral)”, then the working “Δσz = IV·q·M”, “= 0.005 × 73.33 × 48.07” and “= 17.63 kPa”. The stress is calculated from the exact value; the first is the count taken from the shading. When the load covers the whole chart, M = 200 and Δσz = q: a very large area (x from −1000 to 1000 m, y from 0 to 2000 m, A at its middle) gives M = 200.0 and 73.33 kPa.
Using the numbers
- The result is an increase, not the total stress: add the overburden pressure of the soil above A for the total vertical stress.
- The ratio Δσz/q = 0.005 M is the part of the surface pressure that reaches A. With a load of zero the stress is 0 kPa and M is shown as a dash, because the ratio has no meaning without a load.
- Values are rounded where they are drawn, so the last digit of a figure on the drawing can differ by one from the card.
- Change xA, yA, z or zmax after Analyze and everything follows at once; to change the load or a corner, press Edit inputs, which unlocks them and clears the results.
- Changing the unit system after Analyze re-states the cards and the report without a new run. The drawings keep their labels in m and kPa.
Warnings and notes
The bar carries a Warnings (0) button. It opens a window that says “No warnings — the assumptions of the solution hold for these inputs.” None of the runs of this manual gave a warning.
The Calculations tab, the report and the Theory tab
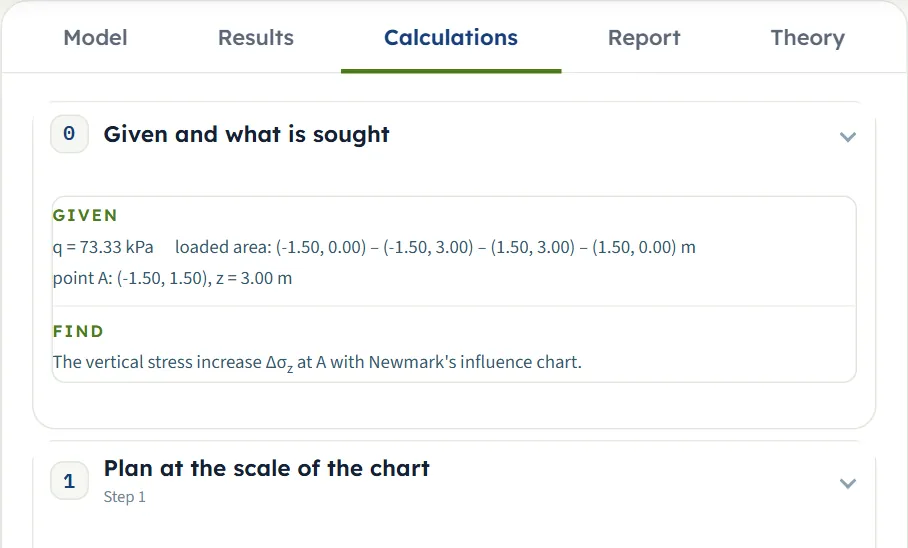
The Calculations tab opens with Given and what is sought (the pressure, the corners in order, the point A and the depth) and then writes out the working in four numbered steps, ending with the answer:
- Plan at the scale of the chart — the 200 elements and their influence IV = 0.005, the radius relation, the area of the plan, AB = z and whether A is under or outside the loaded area.
- Elements covered — M from the exact integral over the polygon, with your numbers.
- Stress at A — Δσz = IV q M with your numbers.
- Stress increase against depth — the same at ten depths down to zmax, the table of the Results tab with the row of A marked.
The report
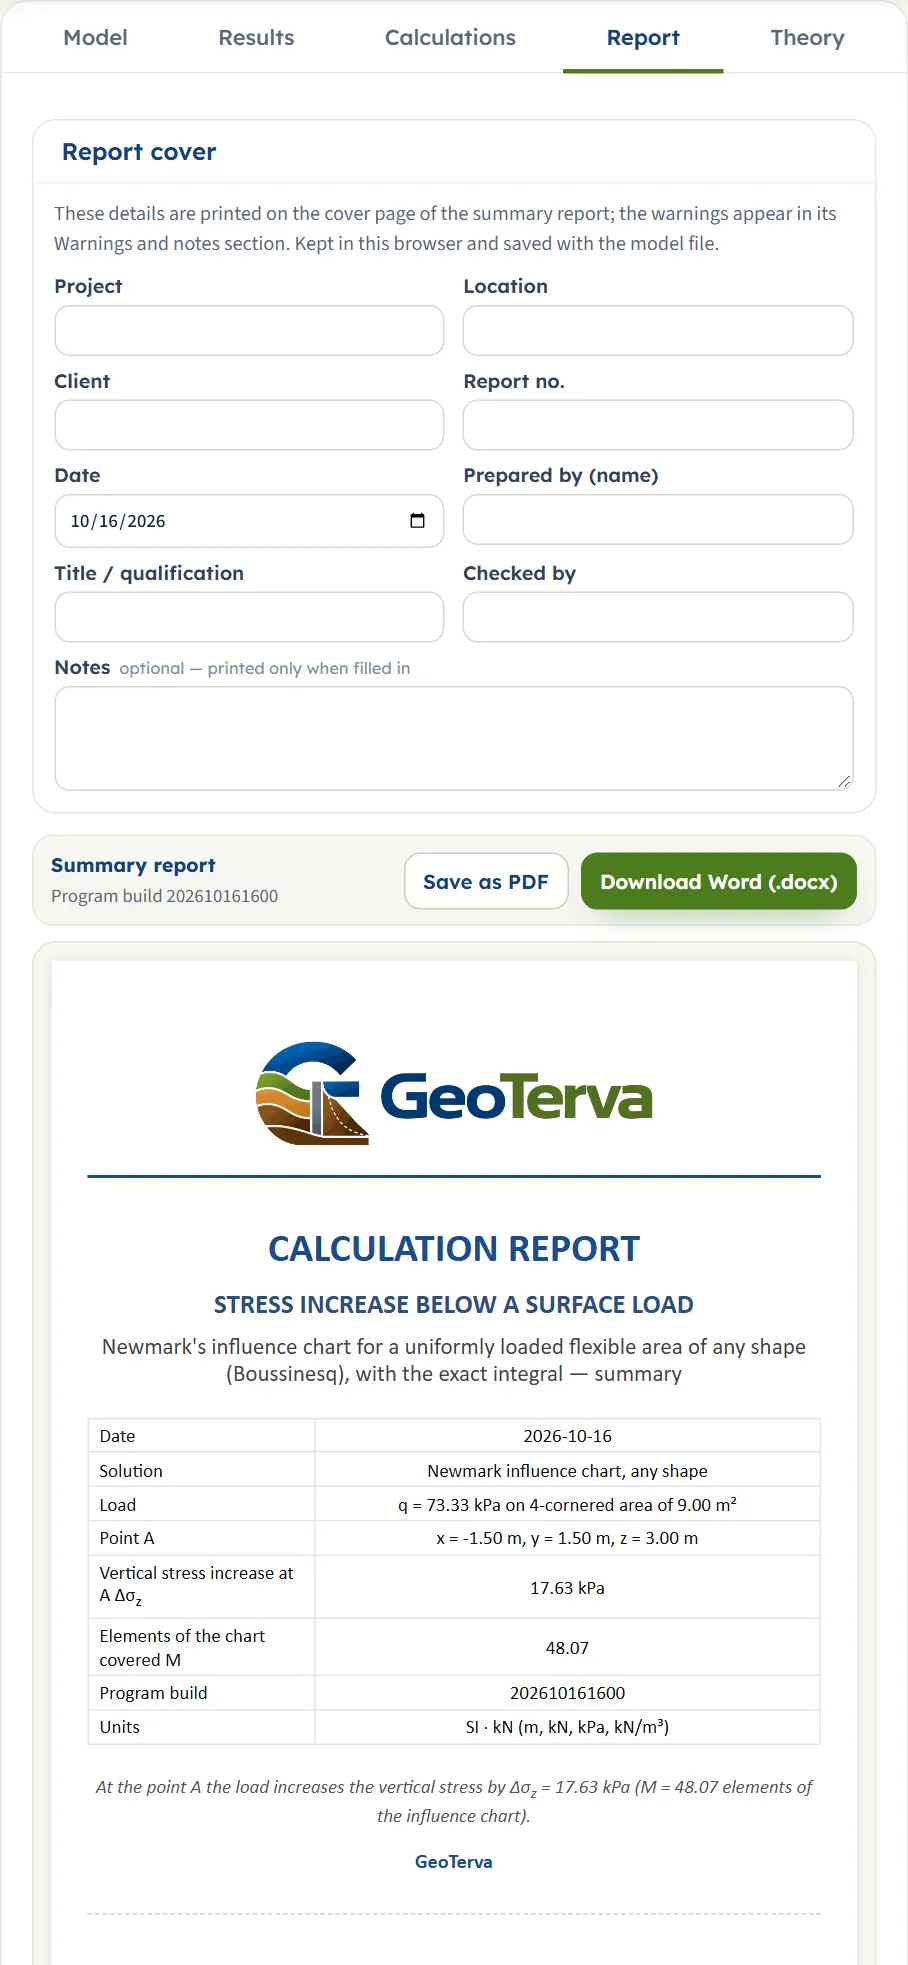
In the Report tab fill in the cover (project, location, client, report number, date, prepared by, title or qualification, checked by, and optional notes). The details are kept in this browser and saved with the model file. Save as PDF and Download Word (.docx) produce the summary report; the preview below the buttons is the report itself.
The report has six parts: 1 Introduction and scope, 2 Input data, 3 Calculation, 4 Results, 5 Summary and 6 References. It carries four drawings, the chart, the section with the lines of equal stress, the profile and the 3D view, and states the units used.
The Theory tab
The Theory tab has five sections: The idea, Newmark’s chart, Using the chart, Worked example and References. Each opens when you click its title (Open all and Close all open or close them together), and the figures in it are computed from the equations; it includes a table of R/z for the pressure ratios 0.05 to 0.95.
Worked example: the module’s own example
The module opens on this example, so you can follow the numbers on your own screen.
| Section | Input | Value |
|---|---|---|
| Load | Pressure | q = 660/9 = 73.3333 kPa |
| Loaded area (plan) | Corners 1 to 4 | (−1.5, 0), (−1.5, 3), (1.5, 3), (1.5, 0) m: a 3 m × 3 m square |
| Point A | Position and depth | xA = −1.5 m, yA = 1.5 m, z = 3 m: the middle of one side |
| Depth profile | Depth | zmax = 12 m |
Step 1: the plan on the chart
The area is 9.000 m², the scale is AB = z = 3.00 m, and A lies on the edge of the area, so the plan sits against the centre of the chart (the Influence chart view).
Step 2: the number of elements
Through A, the line x = −1.5 m splits the square into two rectangles of 1.5 m × 3 m, each with a corner at A. For one of them m = 1.5/3 = 0.5 and n = 3/3 = 1, and the influence factor of a corner is
With m² + n² = 1.25 the root is √2.25 = 1.5, the first term is 1 × 1.5/2.5 × 3.25/2.25 = 0.8667 and the arctangent is tan⁻¹(0.75) = 0.6435 rad, so I3 = (0.8667 + 0.6435)/(4π) = 0.12018. Two such rectangles give Δσz/q = 0.24035, and
These are the two cards of the Results tab and the step of the Calculations tab. The same hand calculation at other depths gives the table of the Results tab: at z = 6 m the rectangles are 1.5 m × 3 m seen at m = 0.25 and n = 0.5, and the module gives 6.971 kPa; at 12 m, 2.055 kPa. An independent integration of Boussinesq’s solution over the square, done outside the module, gives 17.6257, 6.9715 and 2.0553 kPa at 3, 6 and 12 m.
The same shape at another size
Only the plan in units of z matters. A 6 m × 6 m square with A at the middle of one side (xA = −3 m, yA = 3 m) at z = 6 m gives 17.63 kPa and M = 48.07: the same as the example. At z = 3 m it gives 29.32 kPa, and a 1.5 m × 1.5 m square at z = 3 m gives 6.971 kPa, the value of the 3 m square at 6 m.
A long strip, as a check
A rectangle of 3 m × 30 m, with A at the middle of a long side (xA = −1.5 m, yA = 15 m, z = 3 m), is nearly the strip of the Vertical strip load module with B = 3 m. The module gives 29.98 kPa; the strip equation gives 30.00 kPa under the edge of an infinitely long strip, and with A under the middle line (the module’s 40.29 kPa) 40.32 kPa.
Other unit systems
The default example in SI · tf gives 1.797 t/m² (17.63 kPa is 1.797 t/m²), and in US 0.3681 ksf, with M = 48.07 in both. Two checks by hand with round numbers:
- SI · tf. q = 10 t/m² on the example square, A at the middle of one side, z = 3 m: Δσz/q = 0.24035, so Δσz = 2.4035 t/m². The module gives 2.404 t/m².
- US. q = 2 ksf on a square of 10 ft × 10 ft (corners at ±5 ft and 0 to 10 ft), A at the middle of one side (xA = −5 ft, yA = 5 ft) and z = 10 ft: the same ratios, Δσz = 0.24035 × 2 = 0.4807 ksf. The module gives 0.4807 ksf.
How each input changes the answer
Each row changes one thing in the example (the 3 m × 3 m square, q = 73.33 kPa, A at (xA, yA) = (−1.5, 1.5) m, z = 3 m) and runs the module again, in SI · kN. The numbers are the ones the module gives, so you can reproduce any row; an independent integration of Boussinesq’s solution over the same polygon, done outside the module, agrees with every row.
| Change | Δσz (kPa) | M |
|---|---|---|
| The example The reference | 17.63 | 48.07 |
| q = 150 kPa Proportional to the load; M unchanged | 36.05 | 48.07 |
| q = 50 kPa Proportional to the load; M unchanged | 12.02 | 48.07 |
| q = 0 No load, no stress; M is shown as a dash | 0 | — |
| z = 0.01 m At the surface, on the edge of the area: half of q | 36.67 | 100.0 |
| z = 1 m Shallower: the plan covers more of the chart | 33.47 | 91.29 |
| z = 1.5 m | 29.32 | 79.98 |
| z = 6 m Deeper: the plan covers fewer elements | 6.971 | 19.01 |
| z = 12 m | 2.055 | 5.605 |
| z = 30 m Under 1 per cent of q | 0.3465 | 0.9451 |
| Change | Δσz (kPa) | M |
|---|---|---|
| xA = 0 Under the middle of the square: the highest stress at this depth | 24.65 | 67.22 |
| xA = −1.5 m, yA = 0 Under a corner of the square | 12.85 | 35.04 |
| xA = −3 m 1.5 m outside the edge | 6.942 | 18.93 |
| xA = −6 m 4.5 m outside the edge | 0.7226 | 1.971 |
| xA = −31.5 m 30 m outside the edge: a negligible part of q | 0.0002708 | 0.0007386 |
| yA = 6 m 3 m beyond the end of the square, in line with the edge | 1.813 | 4.944 |
| Change | Δσz (kPa) | M |
|---|---|---|
| 6 m × 6 m square, A at the middle of a side, z = 3 m Twice the width at the same depth | 29.32 | 79.98 |
| 6 m × 6 m, z = 6 m Everything doubled: the same as the example | 17.63 | 48.07 |
| 1.5 m × 1.5 m, z = 3 m Half the size: the same as the example at z = 6 m | 6.971 | 19.01 |
| 3 m × 30 m, A at the middle of a long side A long strip: the strip value is 30.00 kPa | 29.98 | 81.76 |
| Triangle (−1.5, 0), (−1.5, 3), (1.5, 0) Half the area of the square, 3 corners | 11.27 | 30.74 |
| House shape of five corners The square with a roof of 1.5 m added | 20.01 | 54.56 |
| L shape of six corners The square with a 1.5 m corner cut away | 14.97 | 40.84 |
| The square, corners anticlockwise The order of the corners makes no difference | 17.63 | 48.07 |
| Change | Δσz (kPa) | M |
|---|---|---|
| zmax = 6 m Changes the table and the profile only | 17.63 | 48.07 |
| zmax = 2 m Less than z: the table runs to the depth of A | 17.63 | 48.07 |
| zmax = 0.5 m The stress at A is unchanged | 17.63 | 48.07 |
The pattern follows the theory. The stress is proportional to q; it depends on the plan in units of z only, so doubling every length together leaves M unchanged; it is highest under the middle of the area; under the area it falls with depth, and beside the area it first rises with depth and then falls; and at the surface it equals q under the area and half of q on its edge. The depth of the profile zmax changes the table and the Profile view but not the stress at A.
Messages: when the module stops, and what it notes
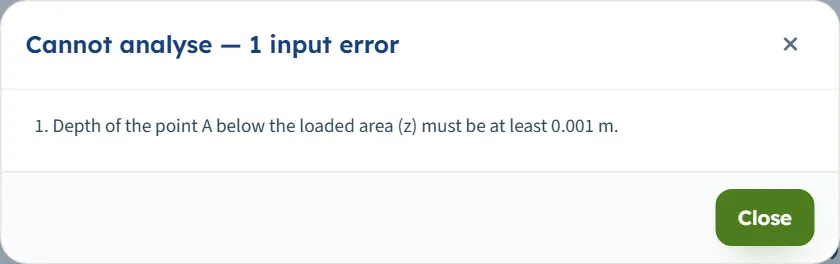
The module checks the numbers it needs before it calculates. When an input cannot be used, press Analyze and a window titled Cannot analyse — 1 input error (or 2 input errors …) lists each message; a box whose value is out of range is marked in red, and a box left empty is named in the message. Nothing is calculated.
| When | Message and what to do |
|---|---|
| q is negative | “Load per unit area (q) must be at least 0 kPa.” Enter zero or a positive load. |
| q is empty | “Load per unit area (q) is missing.” Fill the box. |
| z is 0 or below 0.001 m | “Depth of the point A below the loaded area (z) must be at least 0.001 m.” Enter a depth of at least 0.001 m. |
| zmax is below 0.1 m | “Depth of the profile (zmax) must be at least 0.1 m.” Enter a depth of at least 0.1 m. |
| A co-ordinate of A is empty | “x of the point A (xA) is missing.” and likewise “y of the point A (yA) is missing.” |
| A required corner is empty | “Corner 1 of the loaded area: x (x1) is missing.” Corners 1 to 3 are required; with corner 3 emptied the window reads “Corner 3 of the loaded area: x (x3) is missing. Corner 3: y (y3) is missing.” |
Where a value must reach a limit the message gives it in the units of the unit system chosen. A second kind of stop covers the geometry:
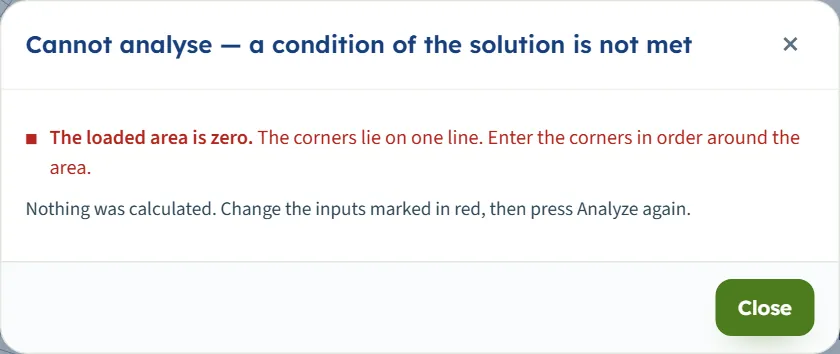
- The loaded area is zero. With corners 1 to 3 on one line (for example (0, 0), (1, 0) and (2, 0)) or all four on one line, the window is titled “Cannot analyse — a condition of the solution is not met” and reads “The loaded area is zero. The corners lie on one line. Enter the corners in order around the area.” followed by “Nothing was calculated. Change the inputs marked in red, then press Analyze again.” An outline that crosses itself, such as the square entered as (−1.5, 0), (1.5, 3), (1.5, 0), (−1.5, 3), whose parts cancel to a net area of zero, gets the same message.
- A corner with one coordinate empty is not an error: it is left out. With corner 4 as x = 1.5 and no y, the module takes the three corners left, a triangle, and gives 11.27 kPa.
Notes and warnings
With every input inside its limits the module calculates, and the Warnings window reads “No warnings — the assumptions of the solution hold for these inputs.” Large values are accepted: q = 1,000,000 kPa on the example gives 240,351 kPa, and a point very far from the area, at (1000, 1000) m, gives a value of the order of 1e-12 kPa, shown in scientific notation.
Good practice and common mistakes
- Use the module for a flexible area with one uniform pressure. The solution is for a flexible load; a stiff footing distributes its pressure differently, and the module gives the stress for the pressure you enter.
- Enter a pressure, not a force. q is a load per unit area: divide a column load by the area of the footing.
- List the corners in order around the area. Either direction is accepted. Corners listed in a criss-cross order draw a bow-tie, not the shape you meant; look at the plan in the Influence chart view before you press Analyze.
- Fill both co-ordinates of every corner you want. A corner with one of the two empty is left out without a message.
- Give A a position clearly under or beside the area rather than exactly on its outline; a point a millimetre inside or outside gives the expected value (for the example square 17.70 kPa at (0, 2.99) and 17.55 kPa at (0, 3.01)).
- Mind the depth and the scale. The plan is drawn at AB = z, so a change of z redraws the plan on the chart; the depth table gives ten depths, each with its own count.
- Add the overburden. The result is the stress increase; for the total vertical stress add the soil weight above A.
- Several areas, several runs. The module takes one area with one pressure; for a second area, run it again and add the two stresses at the same point.
- Place A with the drawing, then type exact values. Dragging snaps to 5 cm; type the co-ordinates when you need a given place.
- Check the units after switching the system: type values in the units shown beside the boxes.
- Keep a record. The report is the record of an analysis; use Quick Save… or Save to file… to keep the model.
Frequently asked questions
How does Newmark’s influence chart work?
The chart has circles for the stress ratios 0.1, 0.2 … 0.9 below the centre of a loaded circle and 20 radial lines, which make 200 elements of equal influence 0.005. The plan of the loaded area is drawn at the scale in which the depth z equals the unit length AB of the chart, with the point A over the centre. The stress is Δσz = 0.005 q M, M being the number of elements the plan covers. For the module’s example M = 48.07 and Δσz = 17.63 kPa.
Does the module count the elements, or calculate the stress exactly?
It takes M from the exact integral of Boussinesq’s solution over the polygon, which is what a perfect count would give, and shows beside it the count read from the shaded chart (“M = 48.0 (read from the chart)” and “M = 48.07 (exact integral)” for the example). The stress uses the exact value.
How many corners can the loaded area have, and what shapes?
Three to six, entered as x and y in order around the area, clockwise or anticlockwise. Corners 1 to 3 are required, 4 to 6 optional. The area may be convex or concave.
Where do I put the origin of the co-ordinates?
Anywhere, as long as the corners and the point A use the same system. The default example has the origin at the middle of one side of the footing and A at the middle of the adjacent side.
Can I put A outside the loaded area?
Yes. A may be under the area or beside it; the plan then sits off the centre of the chart. For the example square, A 1.5 m outside an edge gives 6.942 kPa and 4.5 m outside 0.7226 kPa.
Does the result include the weight of the soil?
No. It is the increase caused by the load only. Add the overburden pressure of the soil above A for the total vertical stress.
Can I drag things on the drawing?
On the Section drawing you can drag the blue point A to place it and the dashed line to set the depth of the profile; they move in 5 cm steps and stay free after Analyze. The corners of the area cannot be dragged: you enter them in the Model tab. The other views have no handles.
What do the lines of equal stress show?
Each line joins the points of the vertical plane through A with the same Δσz, labelled in kPa; the line through A is blue and carries the value at A. Switch them on and off with the Lines of equal stress chip.
What values does the module accept?
q zero or more, z at least 0.001 m, zmax at least 0.1 m, the co-ordinates any numbers, three corners at least, and an area that is not zero. Anything else stops the analysis with a message that names the value.
Which units does it use, and what are the units of the answer?
SI · kN, SI · tf or US, switchable in the header at any time, even after Analyze. Stresses are in kPa, t/m² or ksf and lengths in m or ft. The default example gives 17.63 kPa, 1.797 t/m² or 0.3681 ksf.
What does the report contain?
A cover with your project details and the answer, then six parts: introduction and scope, input data, the calculation step by step, results, summary and references, with the chart, the section, the profile and the 3D drawings. It is saved as a PDF or a Word file once the model is analysed.
Does the module remember my inputs?
Yes. Every change is kept in the browser, and the page opens again on the model you last worked on, including its analysed state. Reset to defaults brings back the example; Save to file and Quick Save keep copies.