

The screen at a glance
Every module of GeoTerva opens in the same workspace. On the left a drawing follows your inputs; on the right a panel holds the model and its answers in five tabs. Learn it once and every module, from a footing to a pile group, reads the same way.
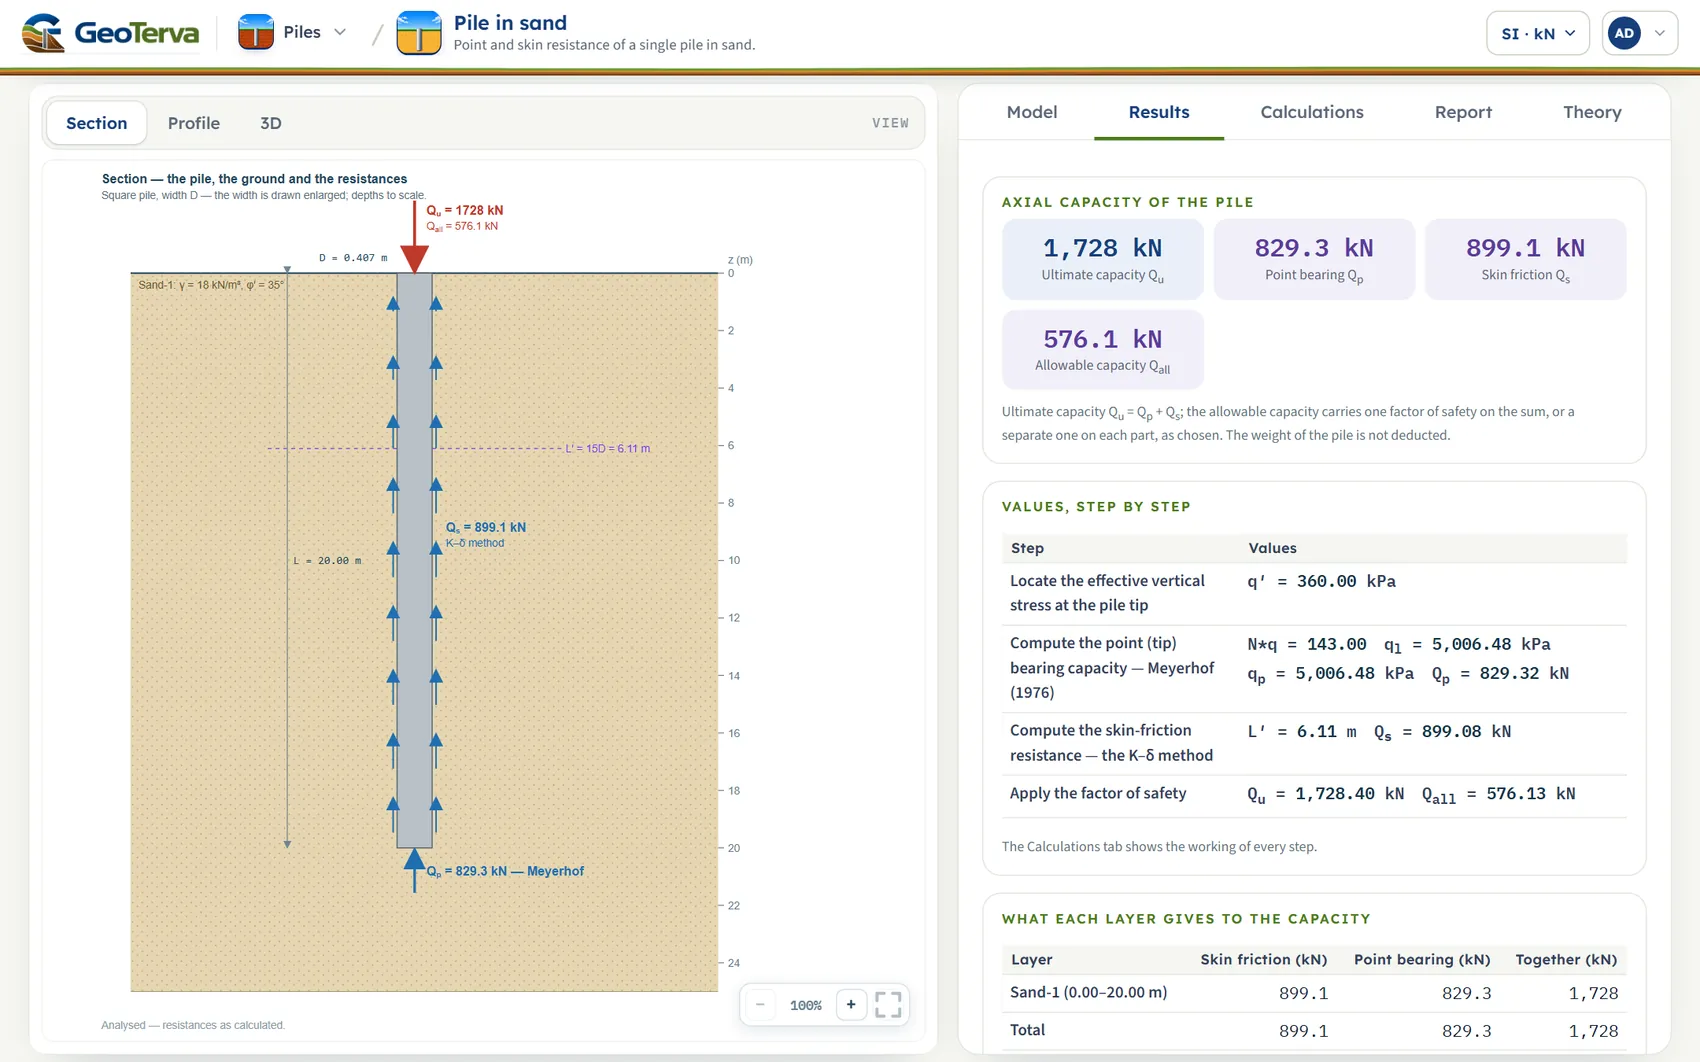
- Family menu. Opens the list of the modules of the family, so you can move from one to the next without going back to the catalogue.
- Units. SI · kN, SI · tf or US. It can be changed at any time, even after Analyze.
- Account menu. Your account, your plan and Sign out.
- Views of the drawing. Section, Profile and 3D for the pile modules; every module names its own.
- The drawing. Drawn to scale from the inputs; after Analyze it carries the results.
- Zoom. Minus, plus and fit; the mouse wheel zooms as well.
- The five tabs. Model, Results, Calculations, Report and Theory.
- The panel. Here the Results tab: the answers in numbers, step by step, layer by layer.
- Layout
- Drawing on the left, panel on the right; on a phone the drawing sits above the panel.
- Tabs
- Model · Results · Calculations · Report · Theory
- Units
- SI · kN, SI · tf and US, switchable at any time
- Your work
- Pile and most other modules: kept in the browser as you type, and saved to a model file or a quick save when you want a copy. The Surcharge Loads modules open on their own example each time; save the model to a file to keep it
- Output
- A summary report as PDF or Word (.docx)
- Works on
- The browser of a desktop, a tablet or a phone; nothing to install
The workflow in four moves
- Describe the model
Open the Model tab and go through its sections from the top: the ground, the water, the structure, the methods, the design values. The drawing on the left follows every change.
- Press Analyze
The Analyze bar at the bottom of the panel checks the model and runs the calculation. When it is done the inputs are locked and the answers are ready.
- Read the answers
The Results tab gives the numbers and the verdict, the Calculations tab writes out every step with its working, and the drawing now carries the results.
- Take the report
The Report tab fills in the cover page of a summary report and saves it as a PDF or a Word file. The Theory tab explains the method behind every number.
The Model tab
The Model tab is a column of sections: Model data first, then the sections of the module, such as the ground, the water table, the pile, the methods and the design values. A section opens when you click its title; the Next and Back buttons at the foot of a section walk you through them in order.
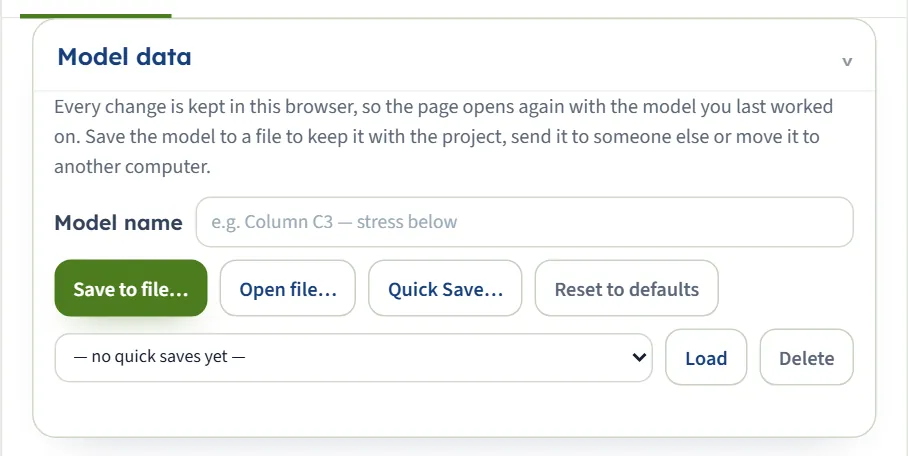
Model data: names, files and quick saves
The first section is the same in every module.
- Model name is a free label for the model, up to 80 characters.
- Save to file… saves the whole model to a file on your computer; you choose the folder and the name. Open file… reads such a file back. Each module writes its own type of file, .gtrv and three letters that name the module (for example .gtrvbtz for the Terzaghi module); a file of an older version (.json) opens too. Installing GeoTerva as an app on a computer (Edge or Chrome) registers these file types, so that a file can show the icon of its module and open with a double click.
- Quick Save… keeps a named version of the model in this browser. The list below it holds the quick saves; Load brings one back and Delete removes it.
- Reset to defaults returns to the worked example the module opened with.
Every change is also kept in this browser as you work, so the page opens again with the model you last worked on. A file is what you keep with the project, send to a colleague or move to another computer.
Sections, the (?) buttons and Back / Next
Each section has a short note at its foot that says what it asks for and why. A round (?) next to a title or a choice opens a help window with a drawing and the formula behind that part of the model. Help windows never change anything; close one with Close or the cross.
Choices: buttons that decide what is asked next
A choice is a row of buttons, for example Circular or Square, Driven, Bored or Jacked. The button you press turns the other fields on or off: a method that needs one more number brings its box into view, and a field that no longer applies disappears. The drawing follows at once.
Layers: add, edit, remove
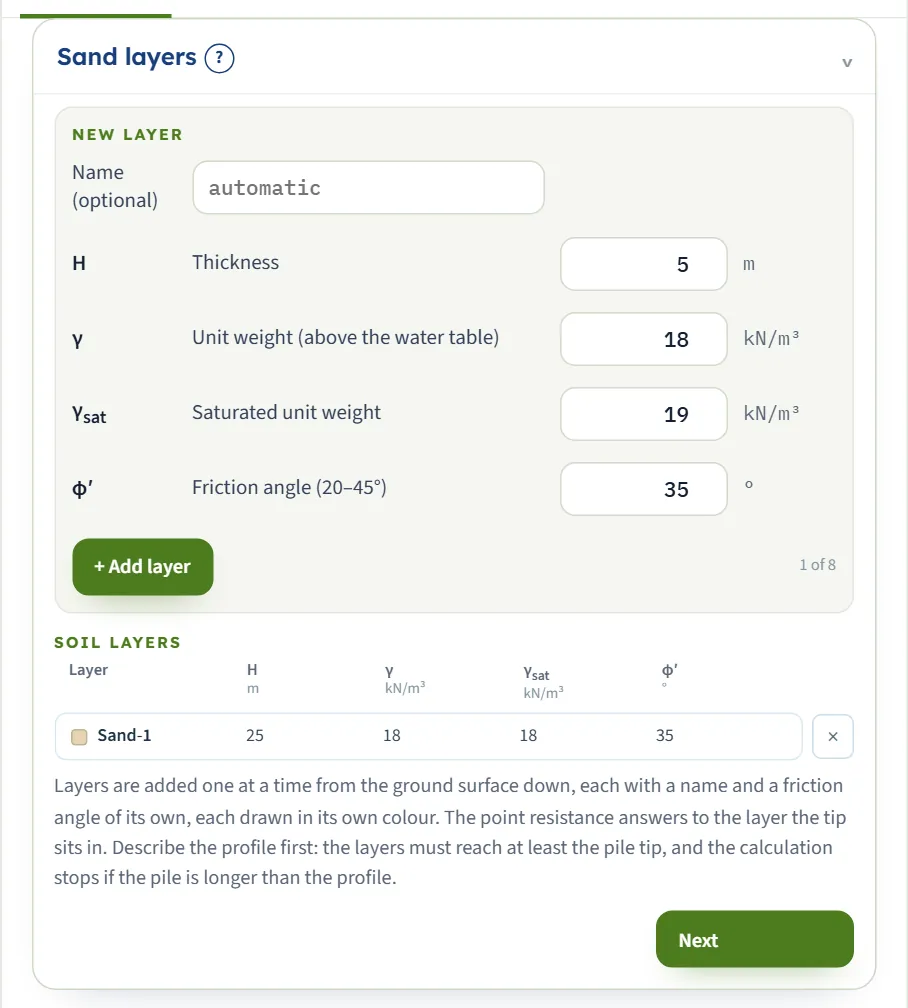
Modules with a ground profile take the layers one at a time from the ground surface down.
- Fill in the New layer form at the top: an optional name, the thickness and the soil values.
- Press + Add layer. The layer joins the Soil layers table below and the counter ("2 of 8") moves on. Up to eight layers can be entered.
- To change a layer, click its row. The form opens with Editing · Layer n in its title; changes apply as you type, and Done closes it. Delete layer removes that layer.
- The small cross at the end of a row also removes a layer.
Each layer is drawn in its own colour in the drawing, and the same colour marks it in the table of layers.
Values that fill themselves in
Some boxes carry a value that the module works out from your other inputs: a chart reading, a coefficient that follows the installation of a pile, a default that follows the friction angle. They are filled in for you and kept up to date as you change the model. Type over one to use your own value; empty the box to get the module’s value back.
Analyze, the lock and Edit inputs
The bar at the bottom of the Model tab shows the state of the model. Before the first run it reads Not analysed and tells you what the module still needs; press Analyze.
When the run has finished the bar reports the run (green, or brown when the run has warnings) and reads Analysed. From that moment:
- The inputs are locked. The numbers you see are the numbers behind the results, so they cannot be edited by accident.
- Edit inputs unlocks the model. It clears the results, and the bar returns to Analyze.
- Warnings shows the cautions and notes of the run, with the number of them in brackets. Most of the assumptions and cautions are printed in the report as well.
- The unit system can still be changed. Switching units does not need a new run.
If something is missing or impossible, the bar turns brown and a window titled Cannot analyse — a condition of the solution is not met lists what is wrong, in plain words and with what to do about it, for example that the layers must reach the tip of the pile. Nothing is calculated; change the inputs marked in red and press Analyze again.
The drawing: views, zoom and dragging
The drawing is made from your inputs, to scale, as you type. The buttons above it choose the view: for the pile modules Section, Profile and 3D, and more where a module has more to show (the lateral pile and the pile group have views of their own, described in their manuals). After Analyze, the views that show results become available.
- Zoom. The + and − buttons and the mouse wheel zoom the drawing; the fit button puts the whole drawing back in the pane.
- Dragging. In several modules you can move a feature of the drawing instead of typing it: the footing of the drawing says what can be dragged (for a pile, the water table, a layer base and the pile tip). Dragging changes the input boxes, so the two always agree.
- Colours. Layers keep their colour in the drawing, in the table and in the results.
Results and Calculations
The Results tab answers the question the module was built for: the capacity, the pressure, the factor of safety, the settlement. It shows the main numbers on cards, a table of the values step by step, and, where the ground is in layers, what each layer contributes. Where the module has a design check it states the verdict in words, never by a colour alone: PASS or FAIL in the axial pile modules, OK or NOT OK where a module checks a limit.
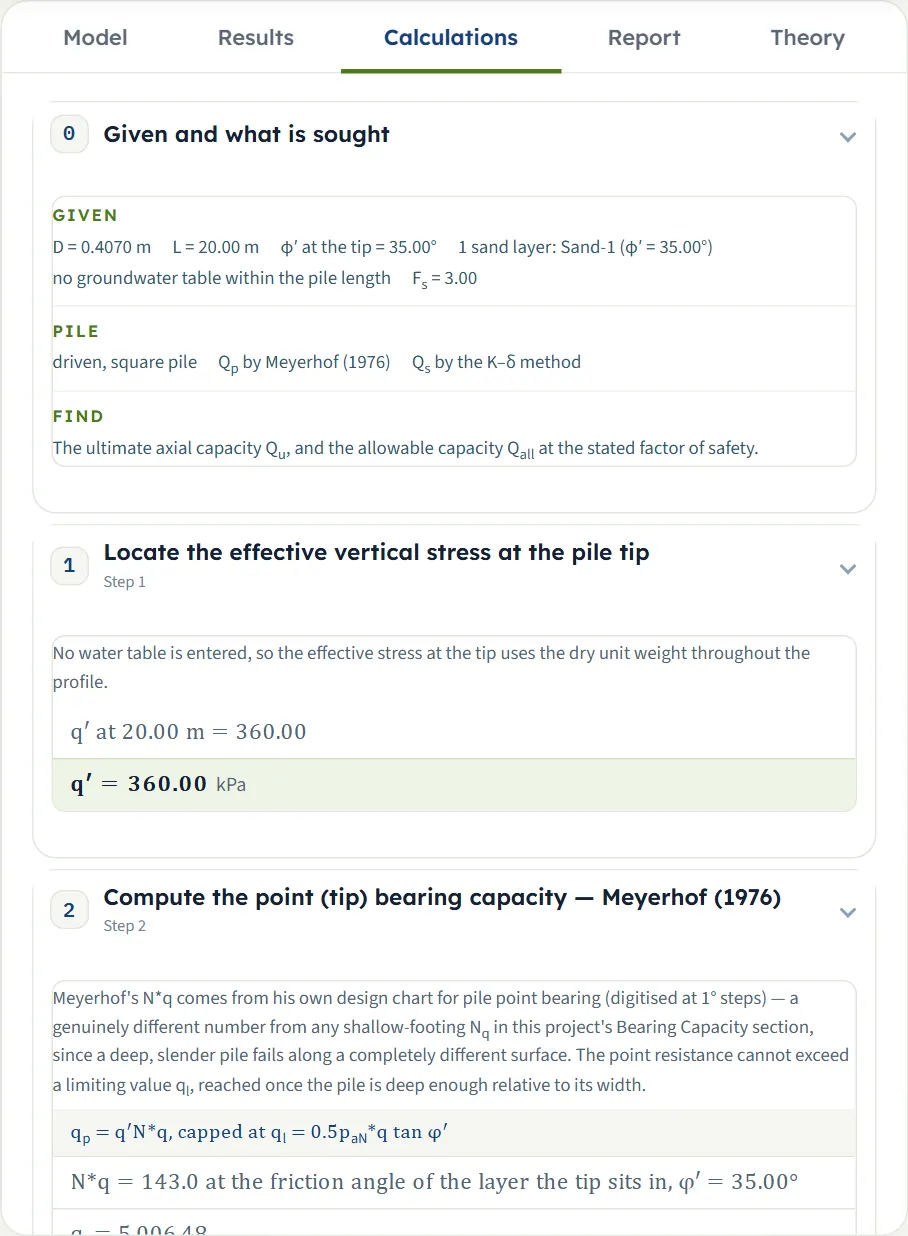
The Calculations tab is the working. It starts with Given and what is sought and then follows the method step by step; each step has a short explanation, the equation with its symbols, and the equation again with your numbers in it, ending with the result of the step. The chapter marked with a tick at the end is the answer in one sentence. Every number on the Results tab can be traced to a step here.
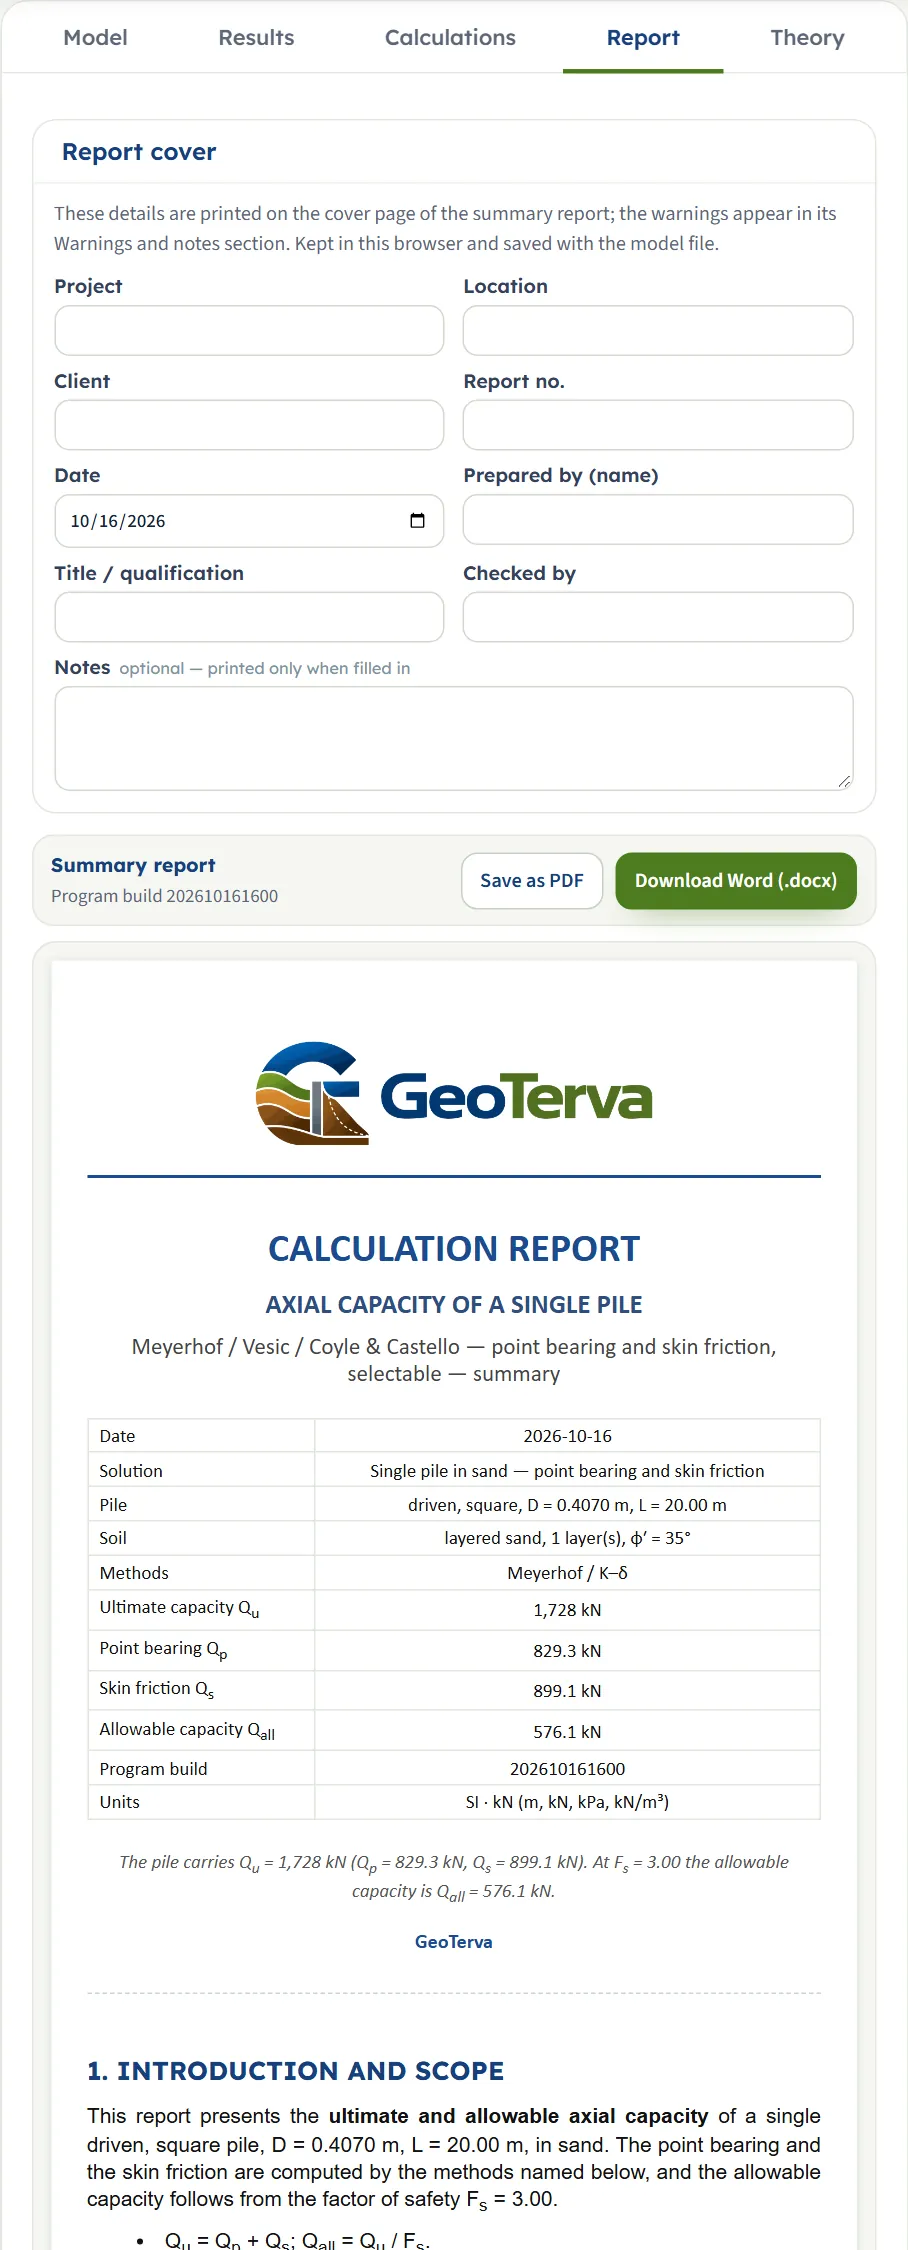
Report: PDF and Word
The Report tab produces a calculation report you can hand to a client or a checker.
- Fill in the Report cover: project, location, client, report number, date, prepared by, title or qualification, checked by, and optional notes. The details are kept in the browser and saved with the model file; the notes are printed only when they are filled in.
- Press Save as PDF or Download Word (.docx). The preview below the buttons shows what the report looks like.
A summary report has the same structure in every module: an introduction and scope, the input data, the calculation step by step, the results, a summary and the references of the methods that were used. The units are stated in the report, with the constants needed to repeat any conversion by hand, and the warnings of the run appear in their own section.
Theory and the help windows
The Theory tab is the method behind the module, written as a short article with a contents list, equations, drawings and the references. Chapters open and close; Open all and Close all do it for the whole page. The figures and the worked example in the theory are computed with the same engine as the module.
The (?) help windows are the short form: one window per section or choice, with a drawing and the formula that part of the model uses. They answer “what does this box mean?” without leaving the Model tab.
Saving, opening and sharing a model
| What | Where it goes | Use it for |
|---|---|---|
| Automatic keeping | This browser | Coming back to the model you were working on; nothing to press |
| Quick Save… | A list in this browser | Keeping several versions of a model to compare, for example two pile lengths |
| Save to file… | A file on your computer | Keeping the model with the project, sending it to someone, moving to another computer or another browser |
| Open file… | Reads such a file | Continuing a saved model; open it in the same module it was saved from |
| Save as PDF, Download Word (.docx) | A report file | The calculation report for the client or the checker |
Units
The unit selector in the header offers three systems:
| System | Length | Force | Pressure and strength | Unit weight |
|---|---|---|---|---|
| SI · kN | m | kN | kPa | kN/m³ |
| SI · tf | m | tf | kg/cm² for cohesion, t/m² for pressure | t/m³ |
| US | ft | kip | psf for cohesion, ksf for pressure | pcf |
Inside the engine every value is SI; the unit system only changes what you type and what you read. Switching it re-writes the boxes in the new units. After Analyze it re-states the results and the report as well, while the drawing of some modules stays in SI units and says so at its top right (the pile group redraws its views in the unit system you choose). The conversion constants (1 tf = 9.80665 kN, 1 kg/cm² = 98.0665 kPa, unit weight of water 9.81 kN/m³) are printed in every report so that a conversion can be repeated by hand.
Frequently asked questions
Does GeoTerva save my work?
Yes, in two ways. The model is kept in your browser as you type, so the page opens again where you left it. For a copy that travels, use Save to file… to write the model to a file, and Quick Save… to keep named versions in the browser.
Why can I not edit the inputs after Analyze?
After a run the inputs are locked so that the drawing, the results, the calculations and the report all describe the same model. Press Edit inputs to unlock them; this clears the results and the bar returns to Analyze. The unit system can still be changed while the model is locked.
Can I change the units after the analysis?
Yes. The unit selector in the header works at any time. The inputs, the drawing, the results and the report are re-stated in the new system without a new run.
How do I get a report?
Open the Report tab, fill in the cover details if you wish, and press Save as PDF or Download Word (.docx). Run Analyze first: the report is made from the analysed model.
What do the warnings mean?
A warning is a caution or a note from the run: an input outside the range of a chart, a method used outside the case it was fitted to, a check that is close to its limit. The Warnings button on the green bar lists them, and the same text is printed in the report.
How do I move a model to another computer?
Use Save to file… on the first computer, copy the file across, and use Open file… in the same module on the second. The automatic copy and the quick saves stay in the browser they were made in.
Does it work on a phone or a tablet?
Yes. GeoTerva runs in the browser, so it works on a phone, a tablet and a desktop without anything to install. On a narrow screen the drawing sits above the panel.