

What the module calculates
Mononobe–Okabe gives the active force on a retaining wall during an earthquake, by the pseudo-static method: the shaking is replaced by two constant forces on the soil wedge behind the wall, khW horizontally toward the wall and kvW vertically, and the force on the wall is that of the wedge that pushes hardest. You enter the two seismic coefficients; the module does not derive them from a site or a code.
ψ is the seismic angle, K′a is the Mononobe–Okabe coefficient (it depends on φ′, the wall friction δ′, the inclination θ of the back, the slope α of the backfill and ψ) and Pae is the dynamic active force per unit length of wall. The module also splits it into the static Coulomb force Pa and the seismic increment ΔPae, and gives the height of the line of action, the force components and the critical failure plane.
What you can describe
- A wall of vertical height H whose back is inclined at θ from the vertical (positive toward the backfill).
- A backfill surface sloping at α (positive rising away from the wall).
- A granular backfill in up to six layers, each with its own unit weights, φ′ and wall friction δ′ (the soil is cohesionless).
- The earthquake by kh and kv.
- A level water table behind the wall, with pore water that either moves with the soil (restrained) or does not (free).
- A uniform surcharge q on the backfill surface.
One soil, no water and no surcharge give the closed form, its working and the curve of trial wedges. Layers, water or a surcharge give the layered form, where each layer takes its own coefficient.
Which module for what
- The pressure without an earthquake: At rest, Rankine, Rankine on a sloping backfill and Coulomb, which this module reduces to when kh = kv = 0.
- The passive side: Passive, log spiral and Passive, earthquake.
- Loads on the backfill that are not uniform: the surcharge-load manuals.
- This module gives the earth pressure. Combine it with the weight of the wall, the passive resistance and the other actions in your own stability checks.
Before you start: what you need
Have these ready from your design:
| What | Notes |
|---|---|
| The wall: H, θ | The vertical height from the top of the wall to its base, and the inclination of the back (0 for a vertical back). |
| The backfill slope α | Rising away from the wall is positive. The backfill must be stable: α cannot exceed φ′ − ψ. |
| The soil: γ, φ′, δ′ for each layer | Effective friction angle of the granular soil, unit weights, and the wall friction against each layer. The module notes that δ′ is usually taken as φ′/2 to 2φ′/3 and warns above φ′. |
| The seismic coefficients kh, kv | The horizontal and vertical accelerations as fractions of g. You choose them in your design; the module has no site or code table. |
| The water table, if any | Its depth below the top of the wall, the saturated unit weight of each layer, and whether the pore water is restrained or free (for free water also the dry unit weight). |
| The surcharge q | A uniform load per unit area on the backfill surface; 0 for none. |
Quick start in seven steps
- Open the module and choose the units
Open Mononobe–Okabe from the Lateral Earth Pressure family. Pick SI · kN, SI · tf or US at the top right; you can change it at any time.
- Describe the wall and the backfill
In Wall type H and θ; in Backfill type α. Press Next to move on.
- Describe the soil
In Soil layers edit the first layer in the table (press its row, change the values, press Done) or add layers with + Add layer. Each layer has γ, φ′ and δ′; every layer but the last also has a thickness.
- Enter the earthquake
In Earthquake type kh and kv.
- Add water and a surcharge if you have them
In Groundwater choose Present and enter the depth zw and the pore-water case; in Surcharge type q.
- Press Analyze
Press Analyze in the bar at the foot of the Model tab. The bar reads Analysed — the earth pressure calculated, the inputs lock, and the drawings carry the pressure and the force.
- Read the answer, the working and the report
The Results tab gives Pae, K′a, ΔPae, the line of action and the components; Calculations gives the working; Report saves a PDF or a Word file.
The screen: four views of the wall
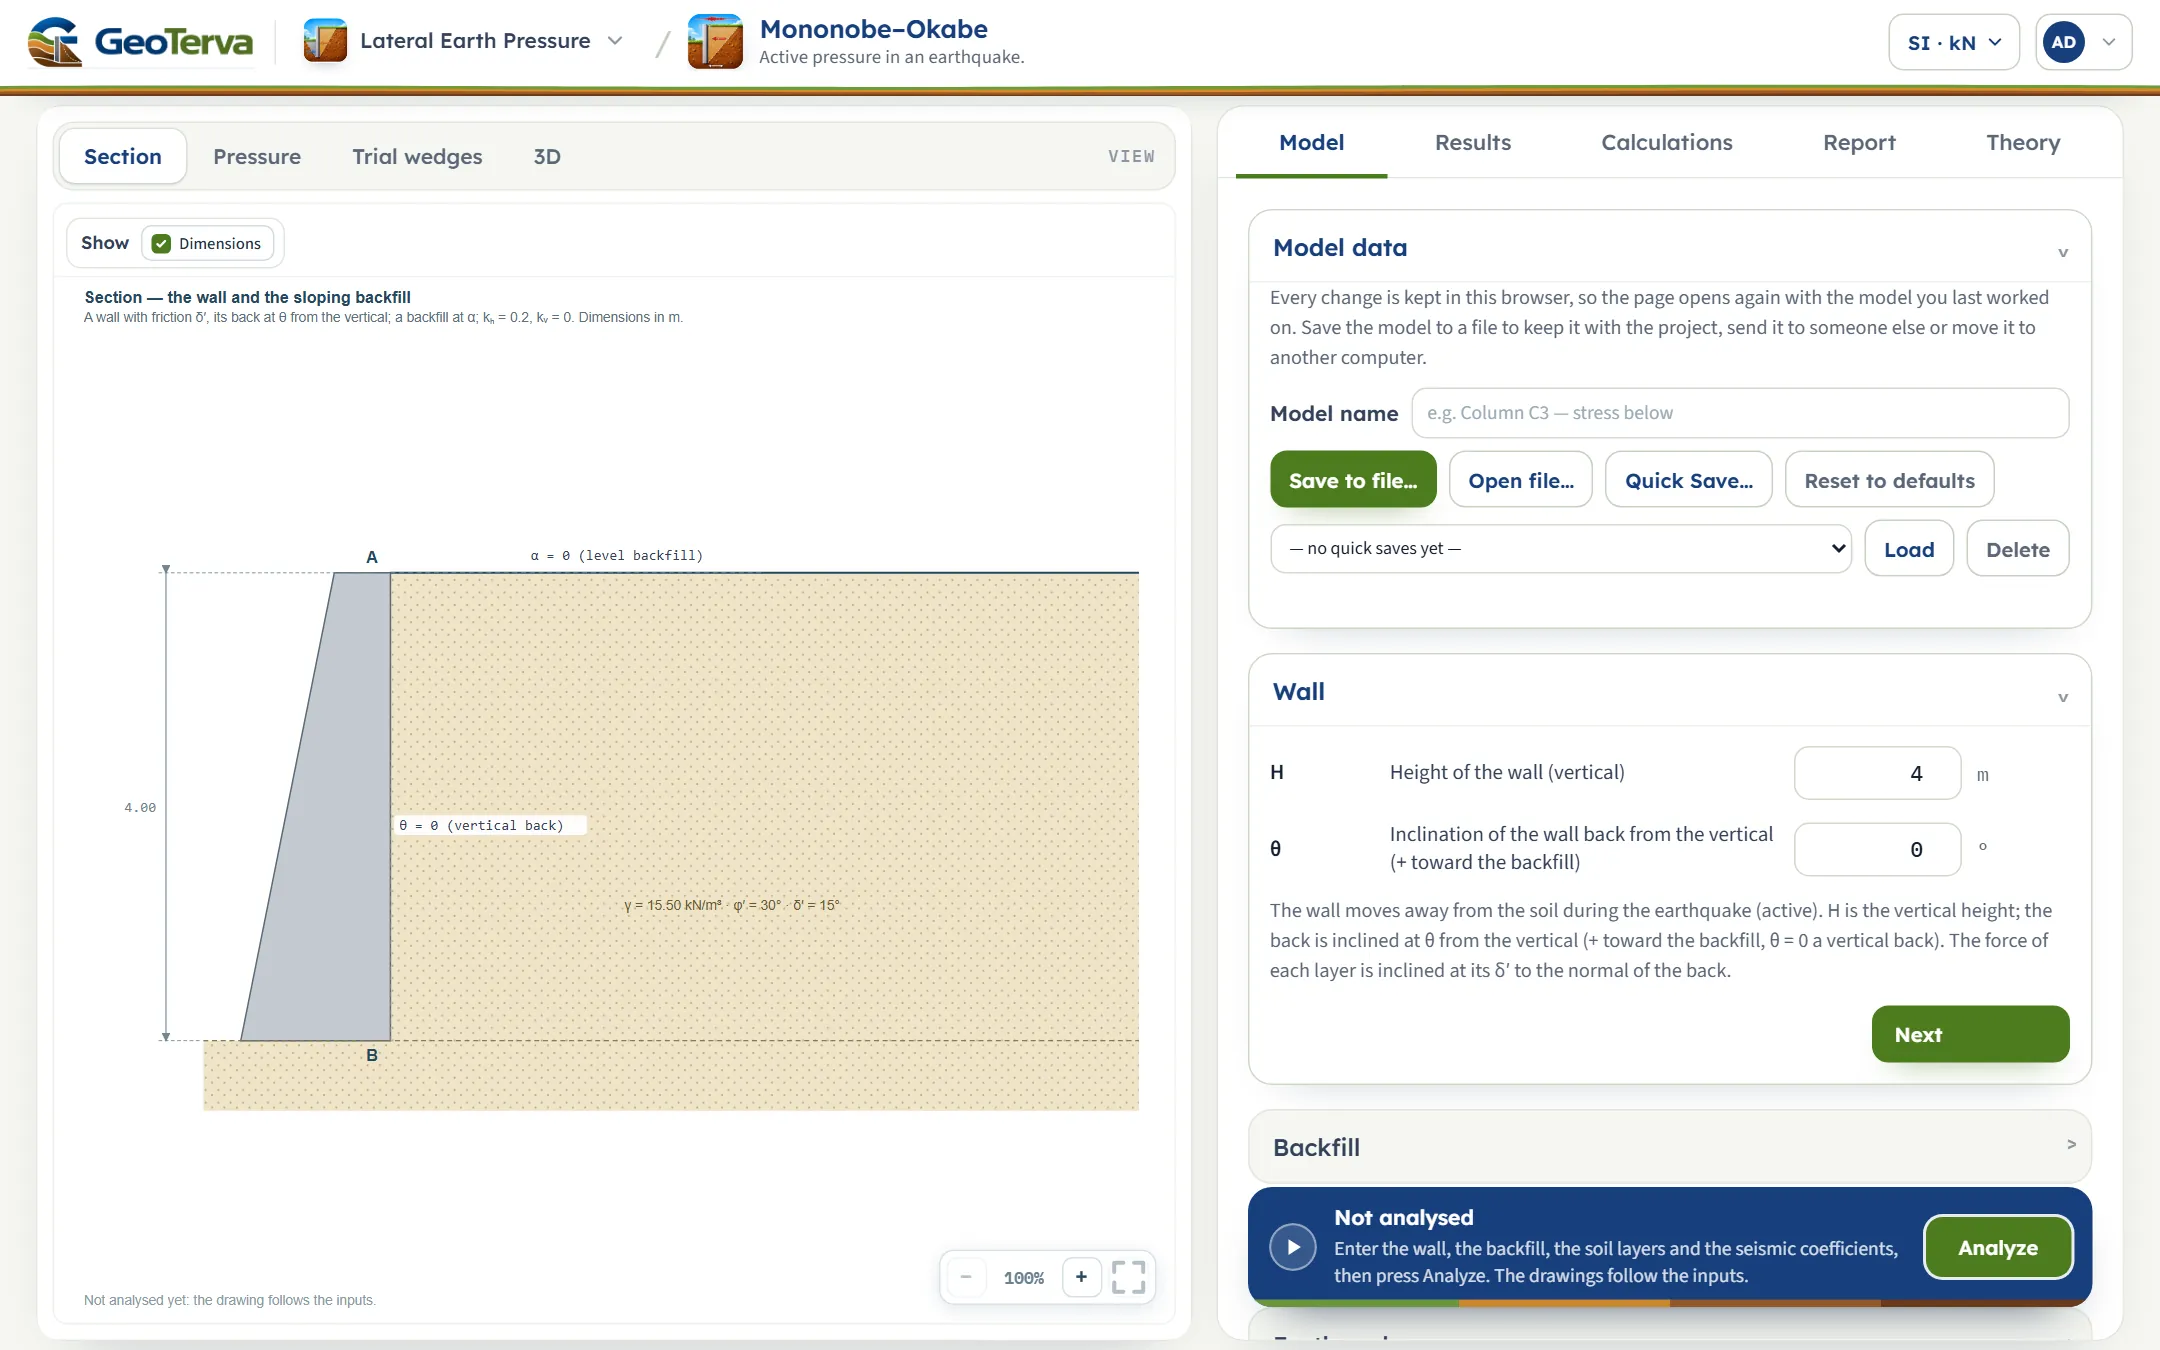
The layout is the one every GeoTerva module shares, described in the workspace guide. The drawing on the left has four views, chosen with the buttons above it, and a pane on the right with the tabs Model, Results, Calculations, Report and Theory.
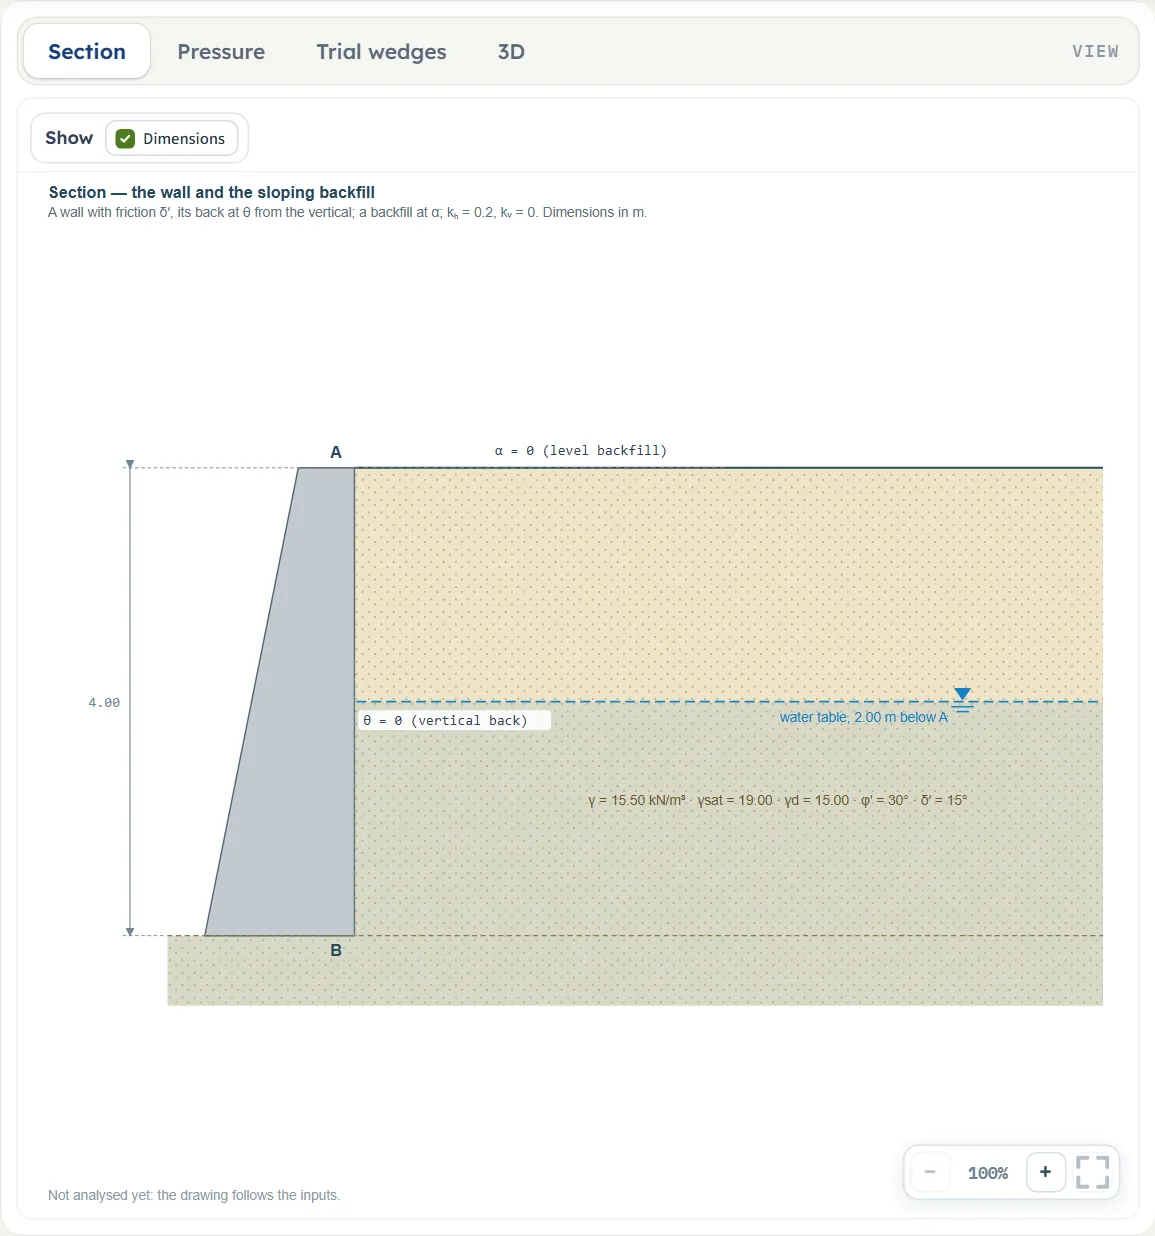
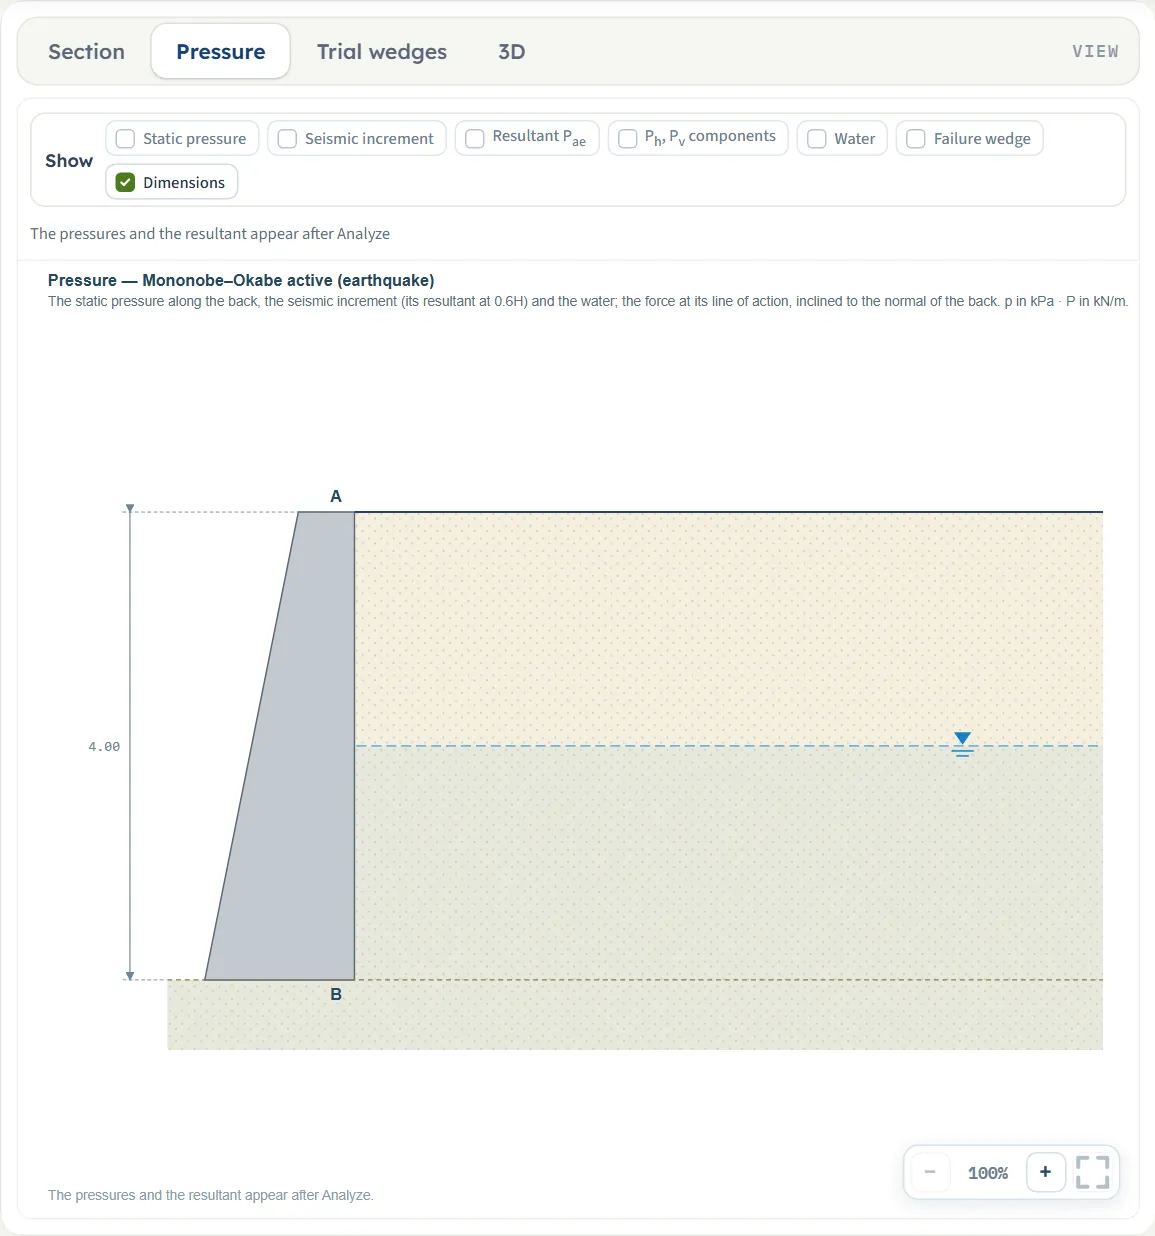
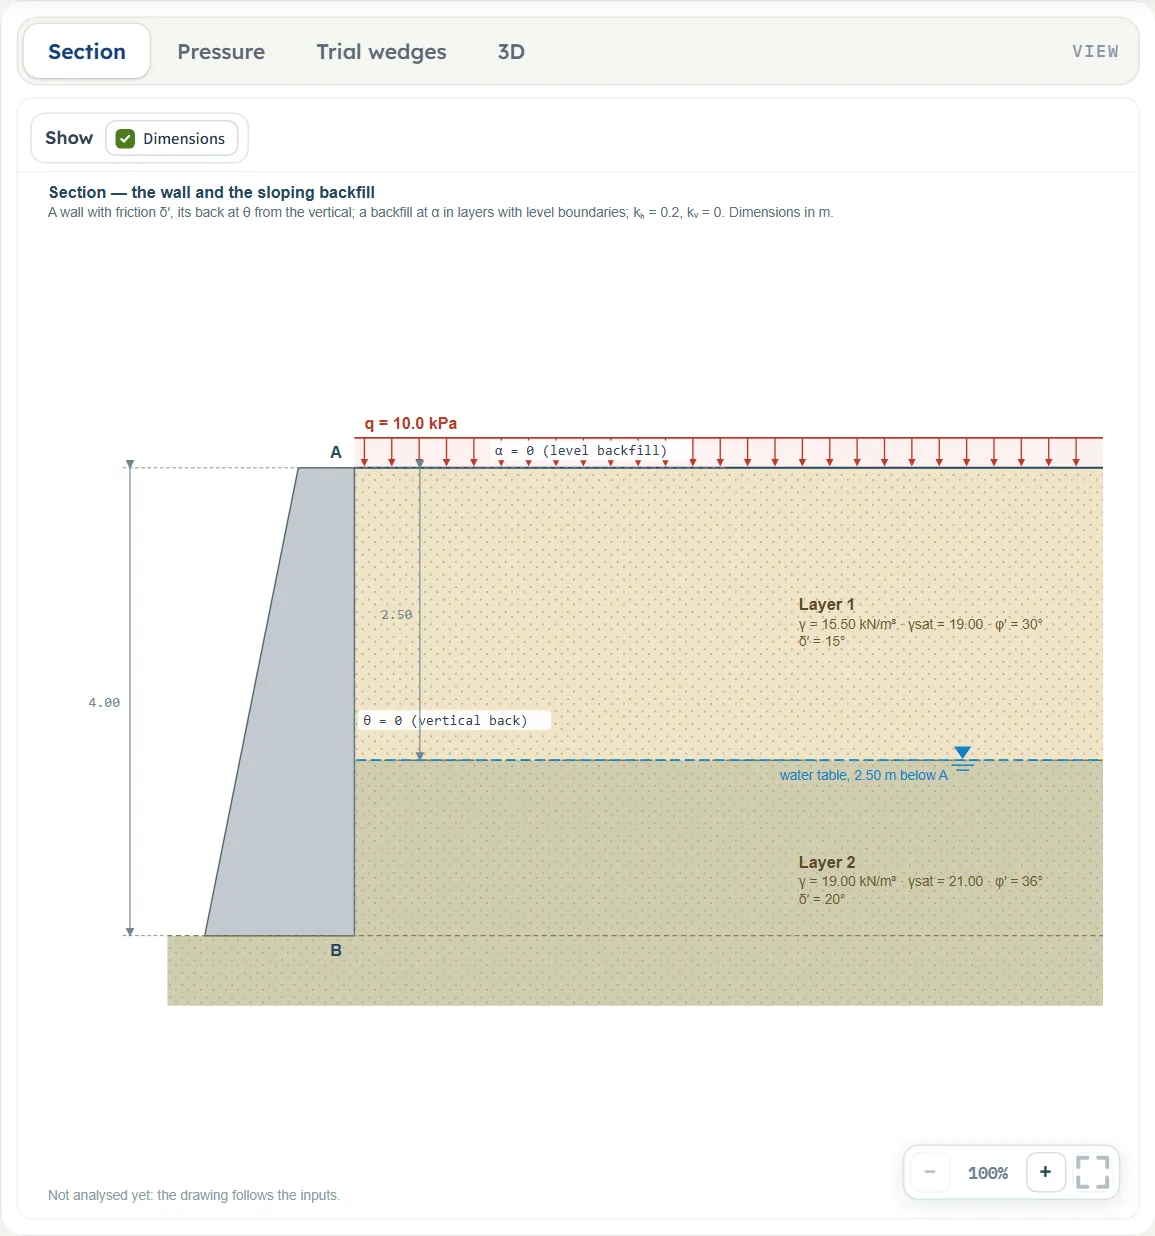
- Section is the geometry only: the wall, its back at θ, the backfill at α, the layers with their values, the water table and the surcharge. It follows the inputs as you type.
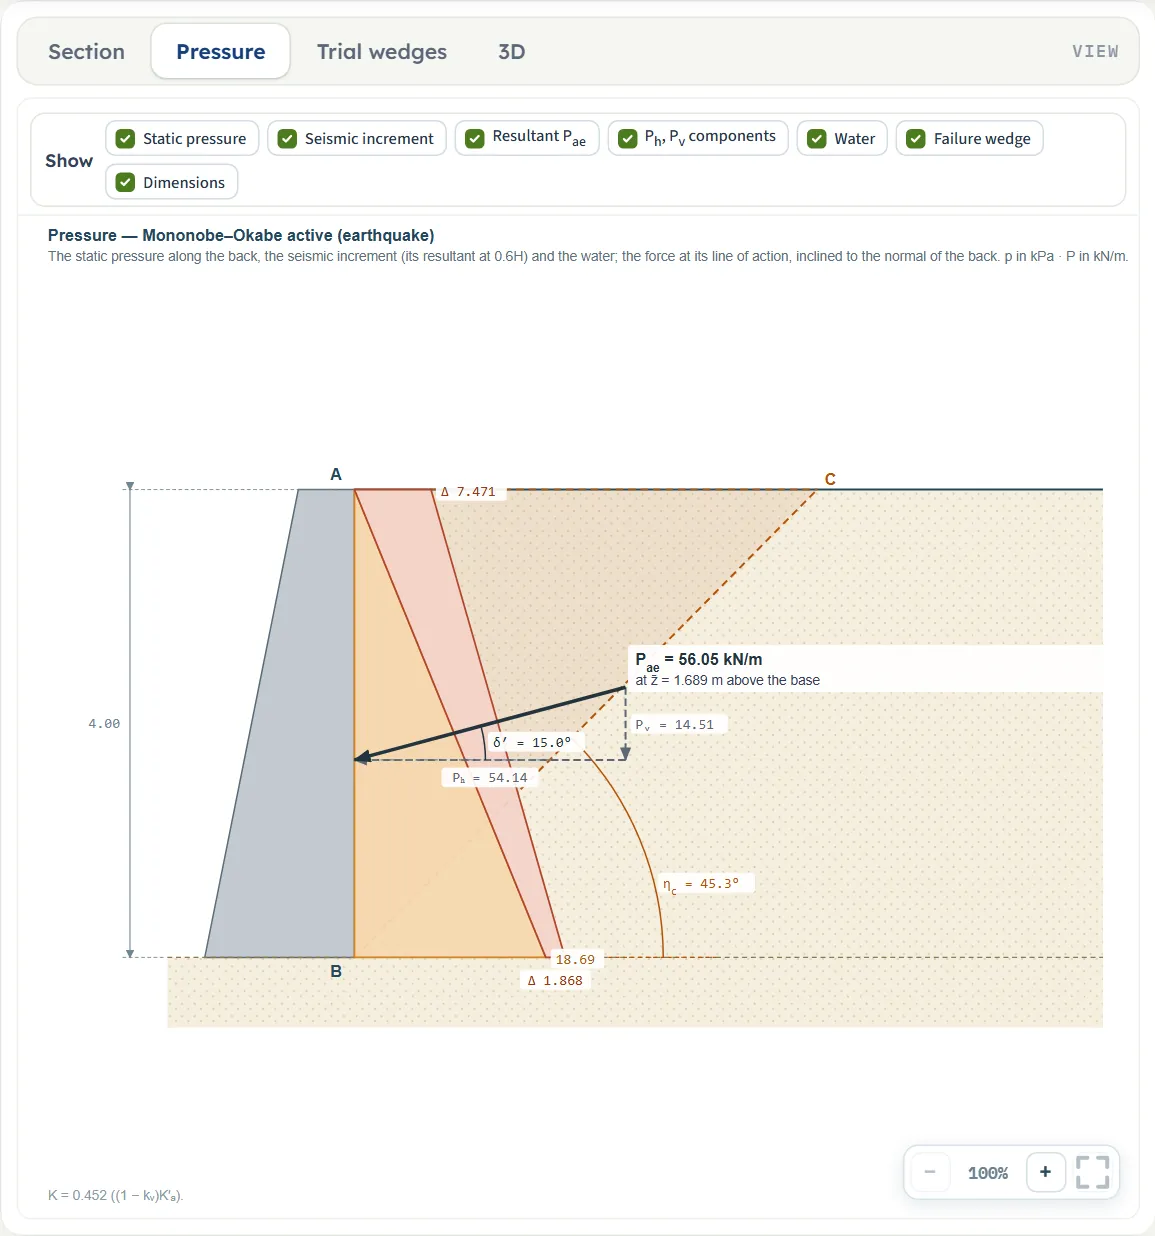
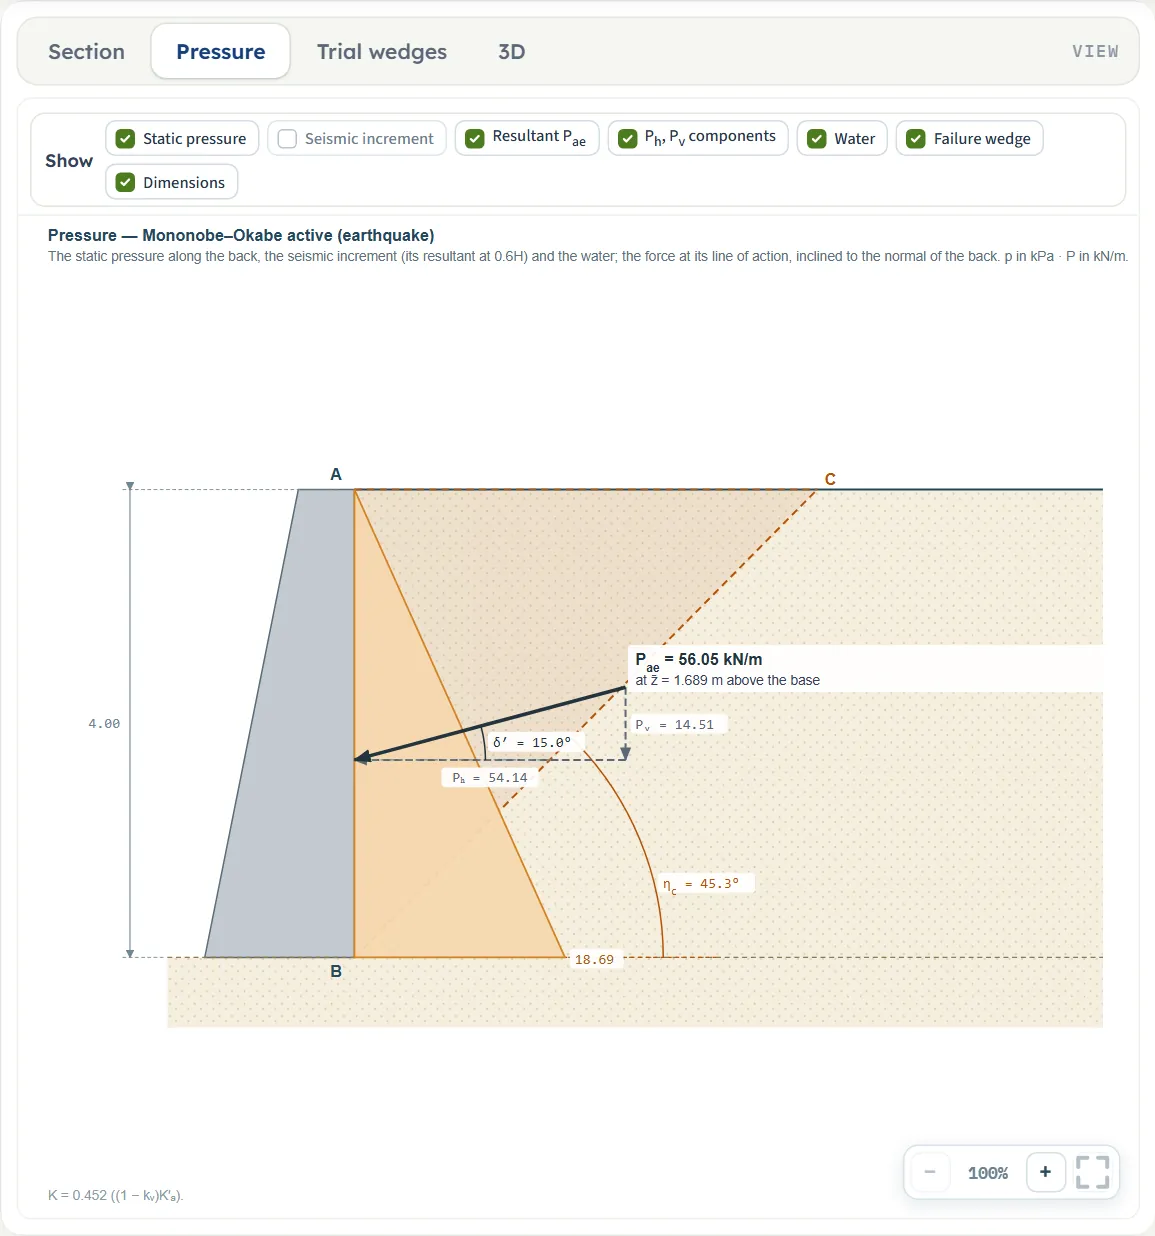
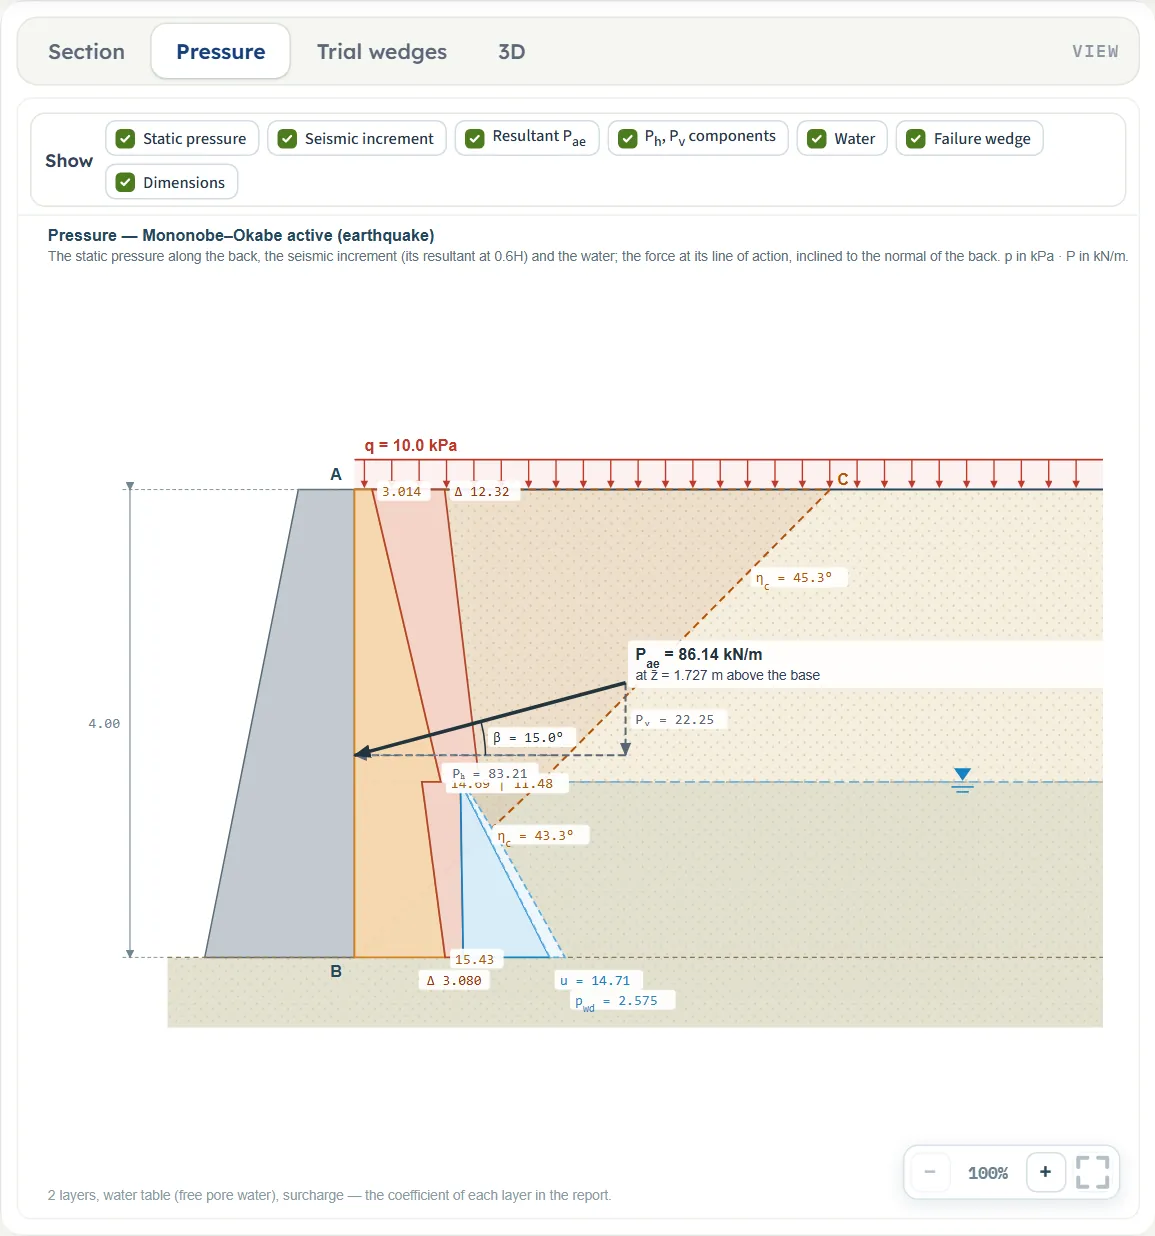
- Pressure adds, after Analyze, the static pressure along the back, the seismic increment drawn with its resultant at 0.6H, the water on the back, the force Pae at its line of action with its components Ph and Pv, and the critical failure plane.
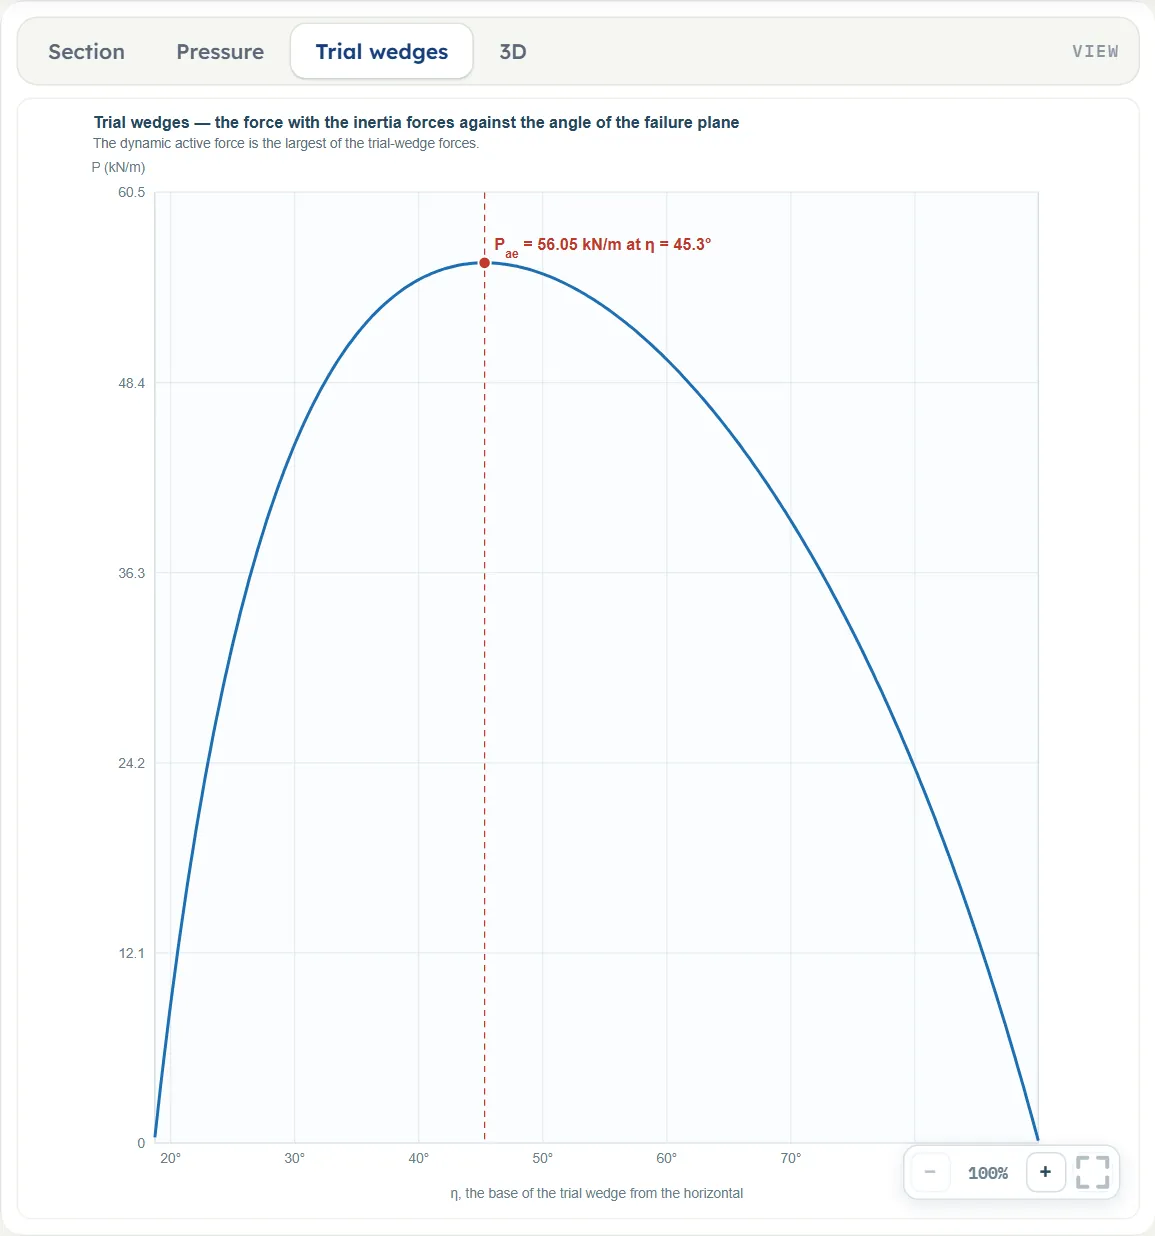
- Trial wedges plots the force of the trial wedges against the angle η of their base plane; the dynamic force is the highest point.
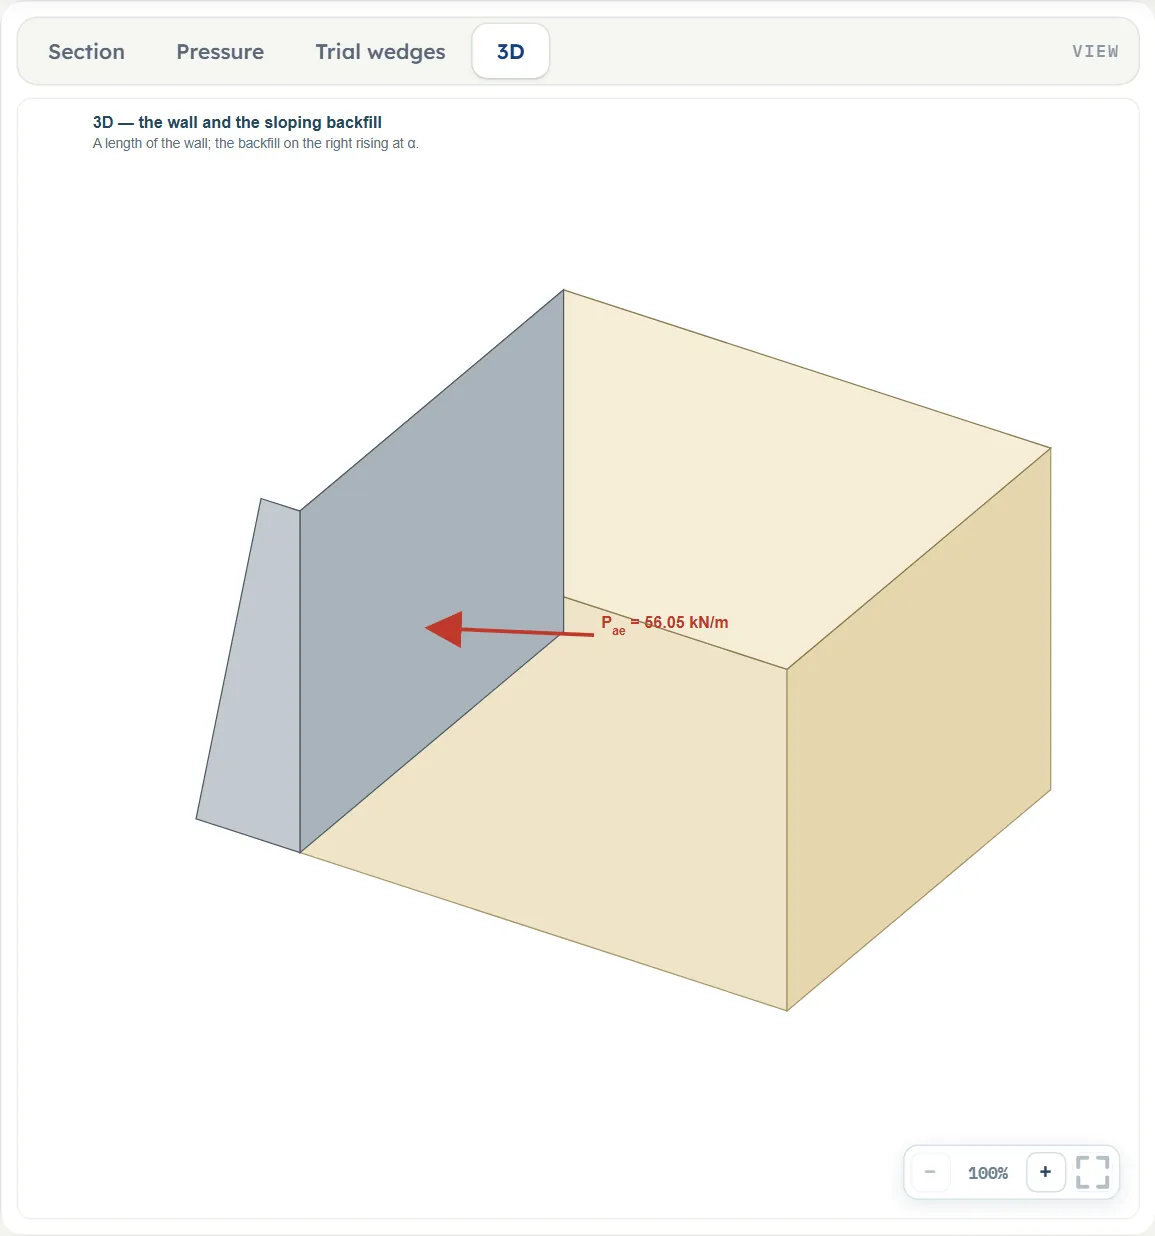
- 3D shows a length of the wall with the backfill and, after Analyze, the force.
Before Analyze the Section view shows the model. This one has a water table at 2 m.
After Analyze the Pressure view shows the example: the static pressure (orange), the seismic increment (red), the failure wedge, and Pae with its components.
The Trial wedges view is the curve of P(η); the dashed line marks the critical plane and the force there.
The 3D view shows the wall, the backfill and the force.
The Show chips
The Show bar above the Section view has one chip, Dimensions. In the Pressure view it has seven: Static pressure, Seismic increment, Resultant Pae, Ph, Pv components, Water, Failure wedge and Dimensions. Before Analyze the first six are unchecked and greyed, with the note “The pressures and the resultant appear after Analyze”; after it they are all checked and you can switch each one.
Zoom, and nothing to drag
No value can be dragged on the drawing; every value is typed in the Model tab. The − and + buttons (or the mouse wheel over the drawing) zoom it (one press of + gives 135%); once zoomed, drag the background to move the view, and the square button fits the drawing again (100%).
Entering the model, section by section
The Model tab is a stack of sections; the one you work in is open, Next and Back walk you through them, and Analyze waits in the bar below. Units are shown in the order SI · kN, SI · tf, US, equal ones merged: for example m · ft. Defaults are in SI; the same example in US units shows 13.12 ft and 98.67 pcf.
Model data
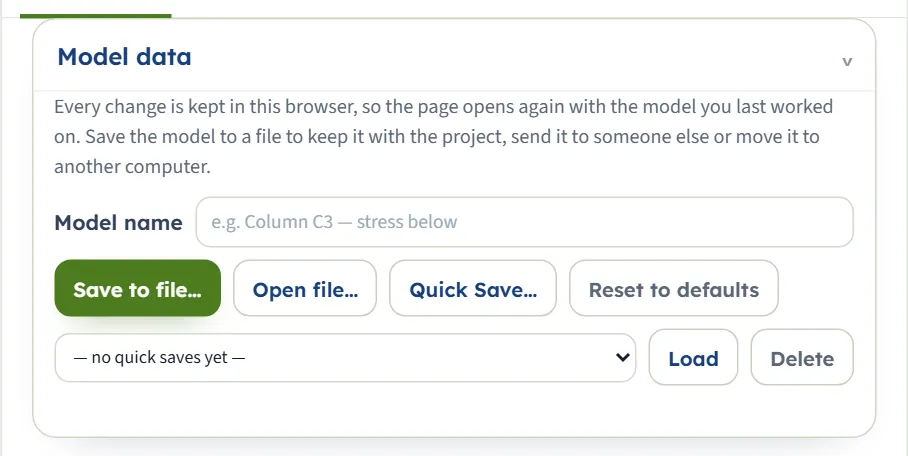
The first section keeps the model. Every change is kept in this browser, so the page opens again with the model you last worked on. Save to file… and Open file… move a model to a file; Quick Save… keeps a named version in the list below it, with Load and Delete; Reset to defaults returns to the example. Model name is a free label.
Wall
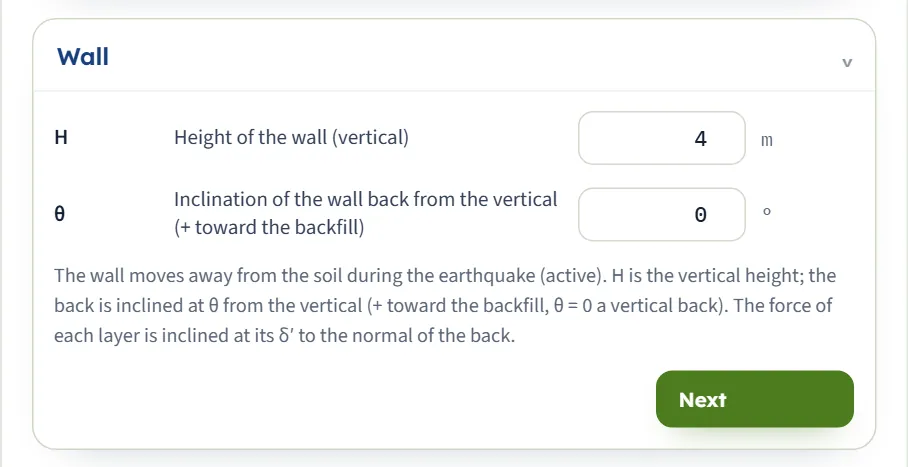
The wall moves away from the soil during the earthquake (active). H is the vertical height; θ is positive when the back leans toward the backfill, and 0 is a vertical back. The force of each layer acts at its δ′ to the normal of the back.
| Field | Unit, default, range |
|---|---|
| Height of the wall (vertical) (H) | m · ft · default 4 · At least 0.1 m |
| Inclination of the wall back from the vertical (θ) | ° · default 0 · −40 to 40. + toward the backfill |
Backfill
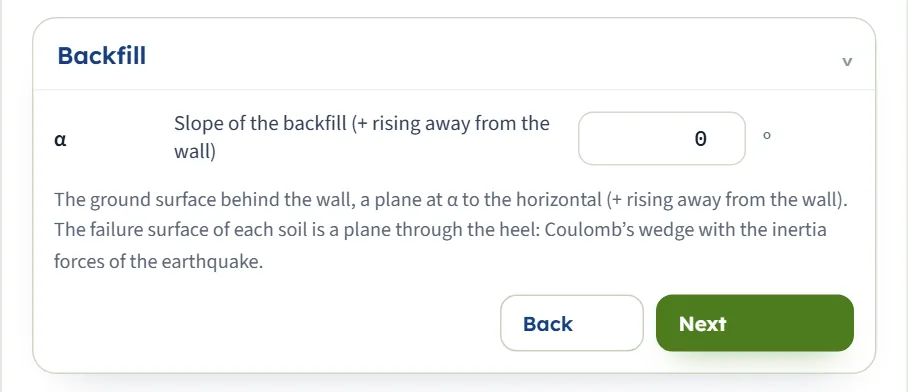
The ground surface is a plane at α to the horizontal; the failure surface of each soil is a plane through the heel of the wall.
| Field | Unit, default, range |
|---|---|
| Slope of the backfill (α) | ° · default 0 · −40 to 45. + rising away from the wall |
Soil layers
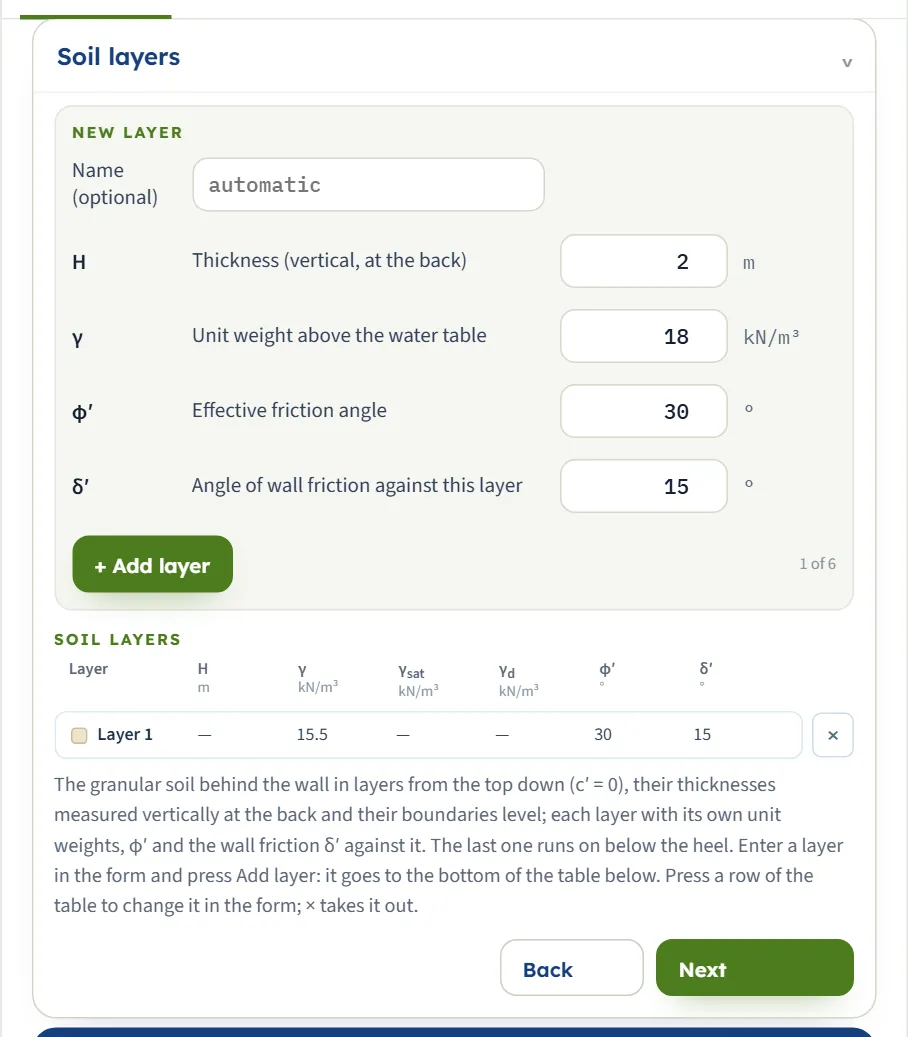
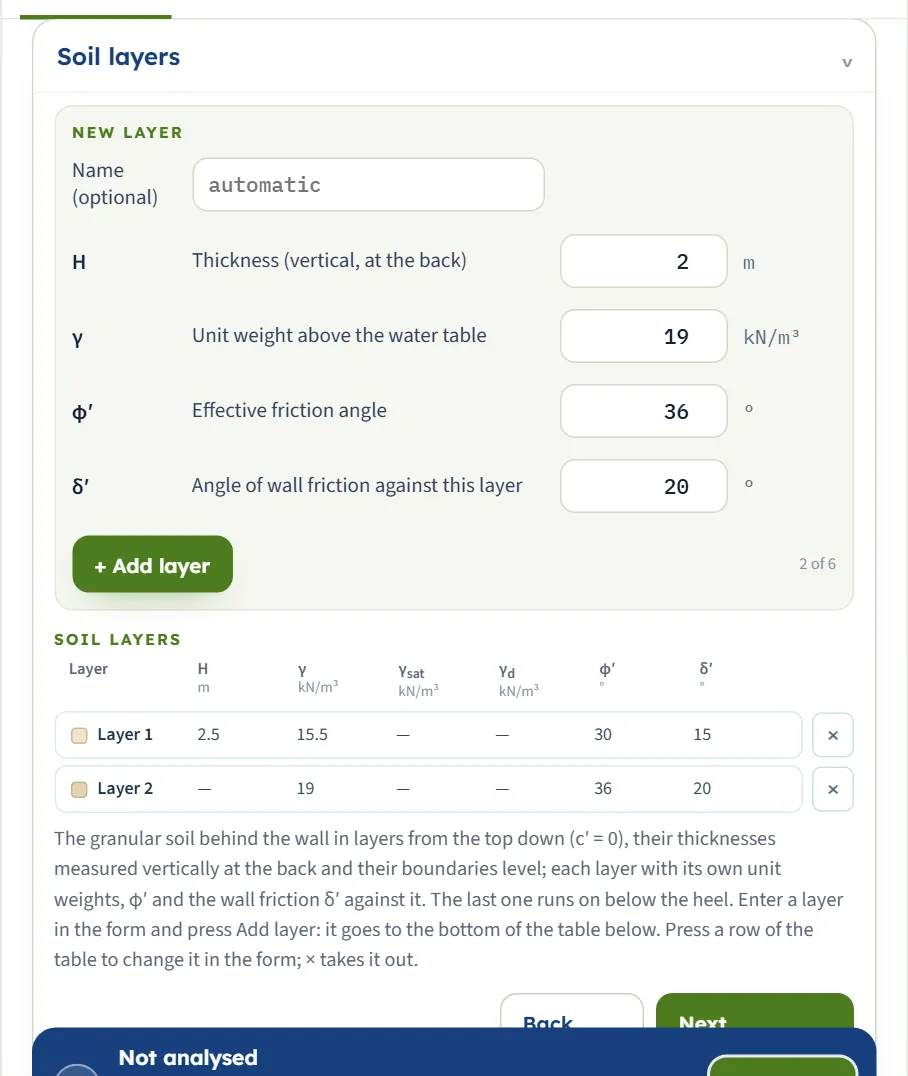
The soil is granular (c′ = 0). Layers run from the top down; their thicknesses are measured vertically at the back and their boundaries are level. The last layer has no thickness: it runs on below the heel. The section has a New layer form with + Add layer (a counter shows “1 of 6”), and a table of the layers below it. Press a row of the table to edit it in the form; × takes a layer out. With one layer the table shows the default row: γ = 15.5, φ′ = 30, δ′ = 15. The table always has γsat and γd columns; they hold values only when water is present (γd only for free pore water), and the form asks for them only then.
| Field | Unit, default, range |
|---|---|
| Name (optional) | text · default automatic · Shown on the drawing and in the tables |
| Thickness (vertical, at the back) (H) | m · ft · default 2 · At least 0.01 m. Not asked for the last layer |
| Unit weight above the water table (γ) | kN/m³ · t/m³ · pcf · default 15.5 (first layer), 18 (new layer) · At least 1 |
| Saturated unit weight (γsat) | kN/m³ · t/m³ · pcf · default 19 (first layer), 20 (new layer) · At least 1, and above that of water. Asked only when water is present |
| Dry unit weight (γd) | kN/m³ · t/m³ · pcf · default 15 (first layer), 16 (new layer) · At least 1, not above γsat. Asked only for free pore water |
| Effective friction angle (φ′) | ° · default 30 · 0 to 50, and above 0 to analyse |
| Angle of wall friction against this layer (δ′) | ° · default 15 (first layer), 15 (new layer) · 0 to 45; typically φ′/2 to 2φ′/3, at most φ′ |
Earthquake
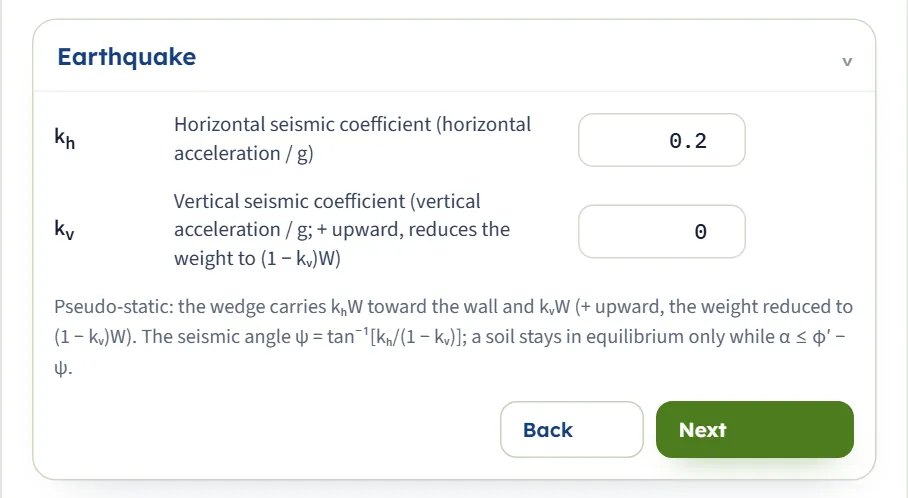
Pseudo-static: the wedge carries khW toward the wall and kvW (upward positive, so the weight becomes (1 − kv)W). A soil stays in equilibrium only while α ≤ φ′ − ψ.
| Field | Unit, default, range |
|---|---|
| Horizontal seismic coefficient (horizontal acceleration / g) (kh) | — · default 0.2 · 0 to 0.9 |
| Vertical seismic coefficient (vertical acceleration / g) (kv) | — · default 0 · −0.5 to 0.5. + upward, reduces the weight |
Groundwater
Choose Present or None (default). With water present the module asks for the depth and for the pore-water case, and the layer form and table gain γsat (and γd for free water). Below a level water table the layers weigh γ′ = γsat − γw in the effective vertical stress and the pore pressure acts normal to the back.
| Field | Unit, default, range |
|---|---|
| Water table | choice · default None · Present or None |
| Depth of the water table below the top of the wall (zw) | m · ft · default 2 · At least 0. A table at or below the base has no effect |
| Pore water in the earthquake | choice · default Restrained · Restrained or Free, each with a (?) window |
- Restrained — moves with the soil (for soils of low permeability, k < 5×10⁻⁴ m/s): the saturated soil carries the inertia, with a seismic angle ψ of its own below the water table.
- Free — highly permeable backfill (k > 5×10⁻⁴ m/s): only the dry mass of the soil carries inertia below the water table, and the free water adds a hydrodynamic pressure on the back.
The (?) beside each case opens a window with a sketch, the formulae and a line headed With the current inputs, which gives Pae for both cases on your model: for the example with a water table at 2 m the window gives 92.9 kN/m restrained and 85.7 kN/m free (the Results tab shows 92.92 and 85.69). Reading it changes nothing.
Surcharge
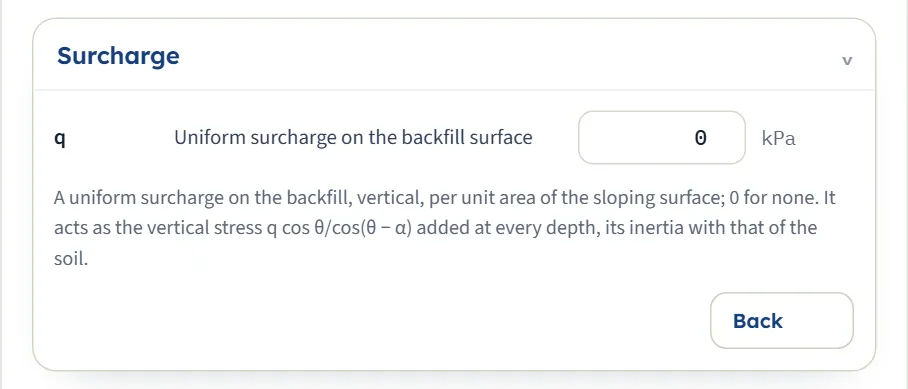
A uniform vertical surcharge per unit area of the sloping surface. It acts as the vertical stress q cos θ / cos(θ − α) added at every depth, and its mass carries inertia like the soil.
| Field | Unit, default, range |
|---|---|
| Uniform surcharge on the backfill surface (q) | kPa · t/m² · ksf · default 0 · At least 0; 0 for none |
Choosing the soil model and the pore-water case
The module has two forms, and which one runs follows your model:
| Model | What runs | You get |
|---|---|---|
| One layer, no water on the wall, no surcharge | The closed form: K′a from the Mononobe–Okabe expression and Pae = ½ γ H² (1 − kv) K′a | Six cards, the Trial wedges curve, a six-step working. The force is at δ′ to the normal of the back. |
| Two or more layers, or water above the base, or q > 0 | The layered form: each layer takes its own K′a under the effective vertical stress below the top of the wall, and the forces are summed along the back | The same cards without K′a (each layer’s K′a is in the table “The layers and their coefficients” on the Results tab and in the Calculations tab), the inclination β of the force, a five-step working. The Trial wedges view says it is drawn for one soil without water or surcharge. |
For a single dry soil the two forms agree. The layered form is an extension of the one-soil solution; for a layered backfill the static and the seismic parts are approximate.
Restrained or free pore water?
Pick Restrained when the backfill is not very permeable, so the water moves with the soil. Pick Free for a highly permeable backfill such as clean gravel or coarse sand; the module then needs γd and adds a hydrodynamic pressure. If you cannot tell, run both: the (?) window gives both results at once.
Analyze and read the results
Press Analyze. The bar changes to Analysed — the earth pressure calculated and says “The inputs are locked. Edit inputs clears the results; the unit system can still be changed.” Edit inputs unlocks the model. A Warnings (n) button sits beside it; with no warning it shows 0.
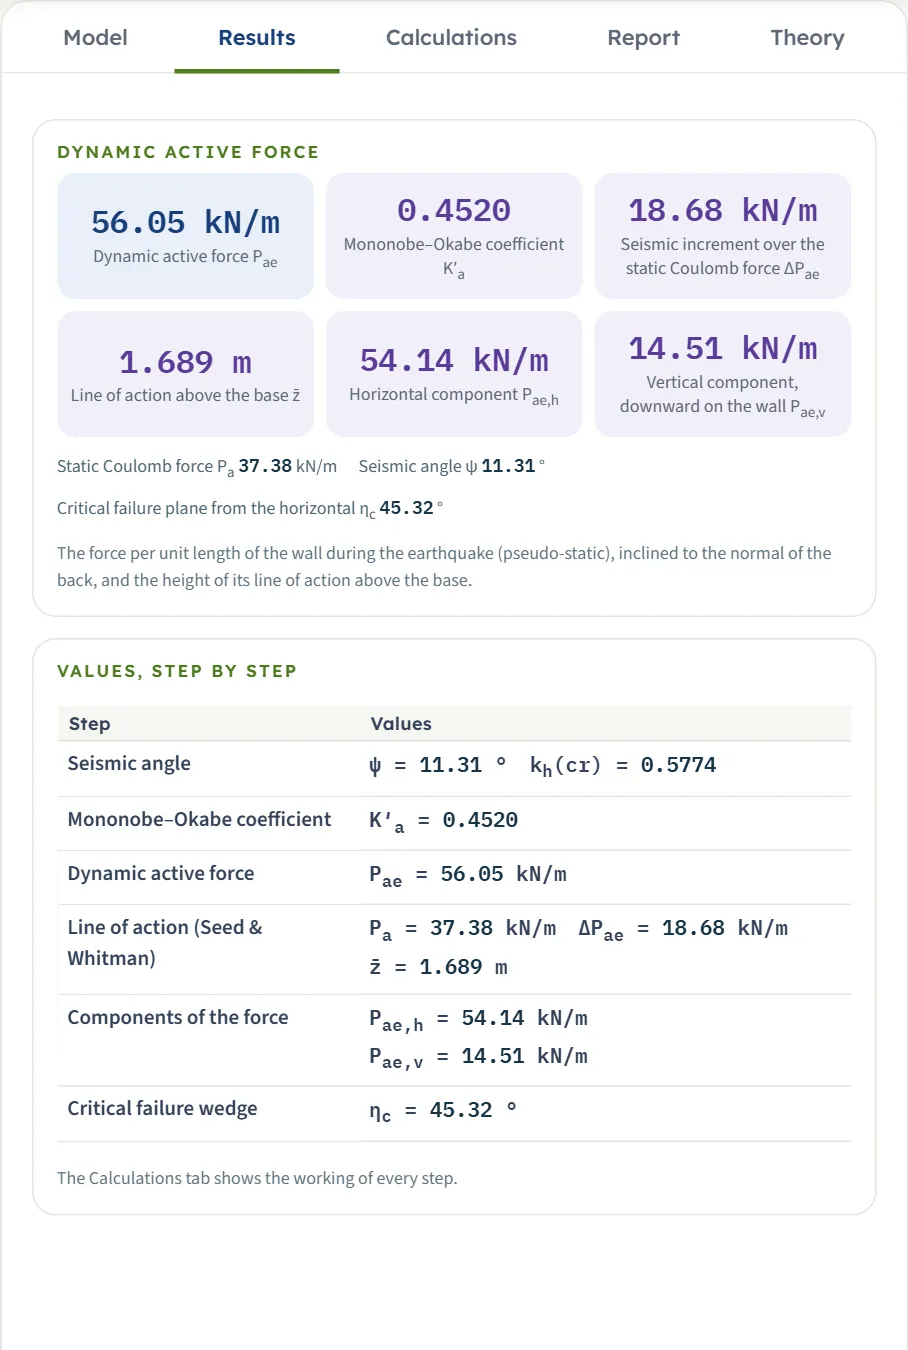
| Card | Symbol | The example |
|---|---|---|
| Dynamic active force | Pae | 56.05 kN/m |
| Mononobe–Okabe coefficient | K′a | 0.4520 |
| Seismic increment over the static Coulomb force | ΔPae | 18.68 kN/m |
| Line of action above the base | z̄ | 1.689 m |
| Horizontal component | Pae,h | 54.14 kN/m |
| Vertical component, downward on the wall (the module labels it upward when it is) | Pae,v | 14.51 kN/m |
Below the cards are the static Coulomb force Pa = 37.38 kN/m, the seismic angle ψ = 11.31° and the critical failure plane ηc = 45.32° from the horizontal, then a table of the values of each step.
Layers, water and a surcharge
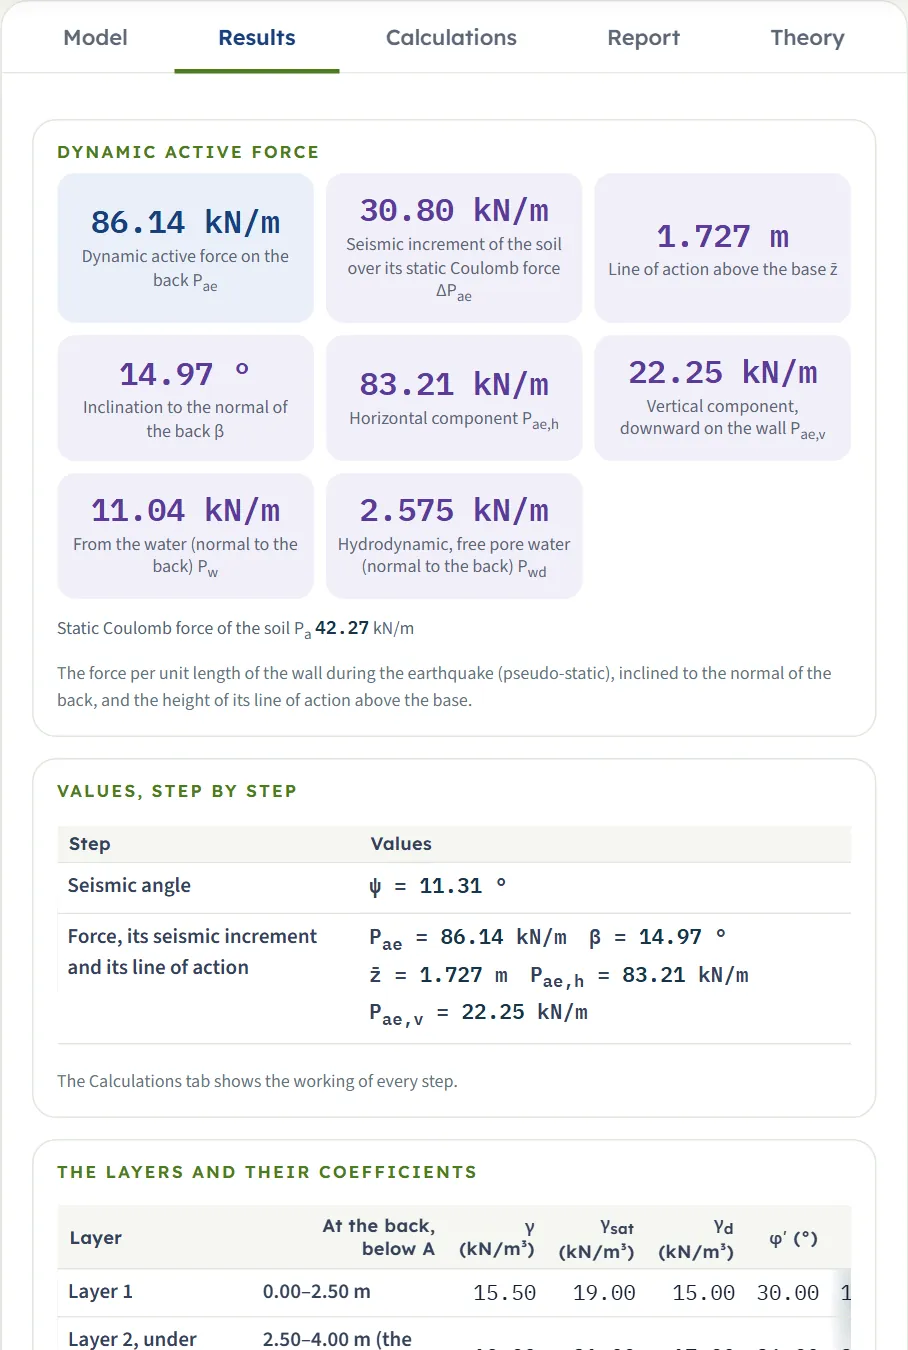
In the layered form the cards change: the force is “on the back”, the card K′a gives way to the inclination β of the force to the normal of the back, and two cards appear for water, Pw (the water on the back) and, for free pore water, Pwd (the hydrodynamic part). The tab also lists each layer with its coefficients.
Using the numbers
- Pae is the force per unit length of wall, inclined to the normal of the back: at δ′ in the one-soil form, at β in the layered form. Pae,h is horizontal into the wall; Pae,v is vertical, downward on the wall.
- z̄ is the height of the line of action above the base: the static part is placed at H/3 (where its pressures put it in the layered form) and the seismic increment at 0.6H. The module notes that this split is approximate and does not model the dynamics of the soil.
- Changing the unit system after Analyze re-states the cards, the drawings and the report without a new run.
The Calculations tab, the report and the Theory tab
The Calculations tab opens with a card Given and what is sought and then writes out the working in numbered steps. Each step shows its equation, the equation with your numbers and the result. The one-soil form has six steps:
- Seismic angle — ψ = tan⁻¹[kh / (1 − kv)], and the limit kh(cr) = (1 − kv) tan(φ′ − α), which for the example is 0.5774.
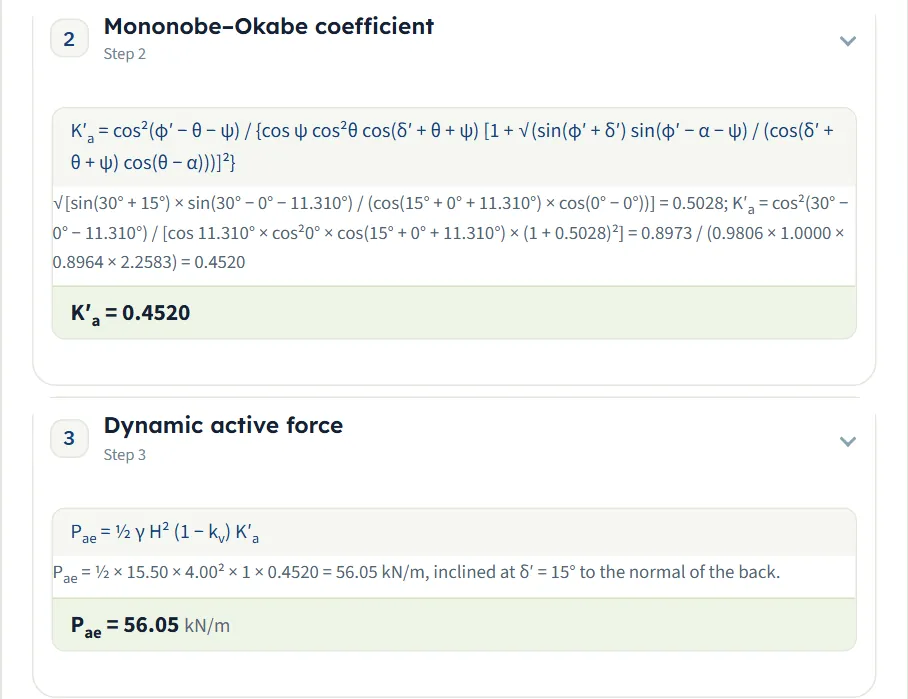
- Mononobe–Okabe coefficient — K′a with every number substituted.
- Dynamic active force — Pae = ½ γ H² (1 − kv) K′a.
- Line of action (Seed & Whitman) — the static Ka and Pa, ΔPae = Pae − Pa and z̄.
- Components of the force — Pae,h and Pae,v .
- Critical failure wedge — the trial-wedge force Pae(η) and the critical plane ηc, with a check that it gives the same force as K′a.
The layered form has five steps: the seismic angle (for each water zone), the coefficient of each layer (with a table of the layers), the stresses on the back, the force with its seismic increment and line of action, and the critical failure plane of each layer.
The report
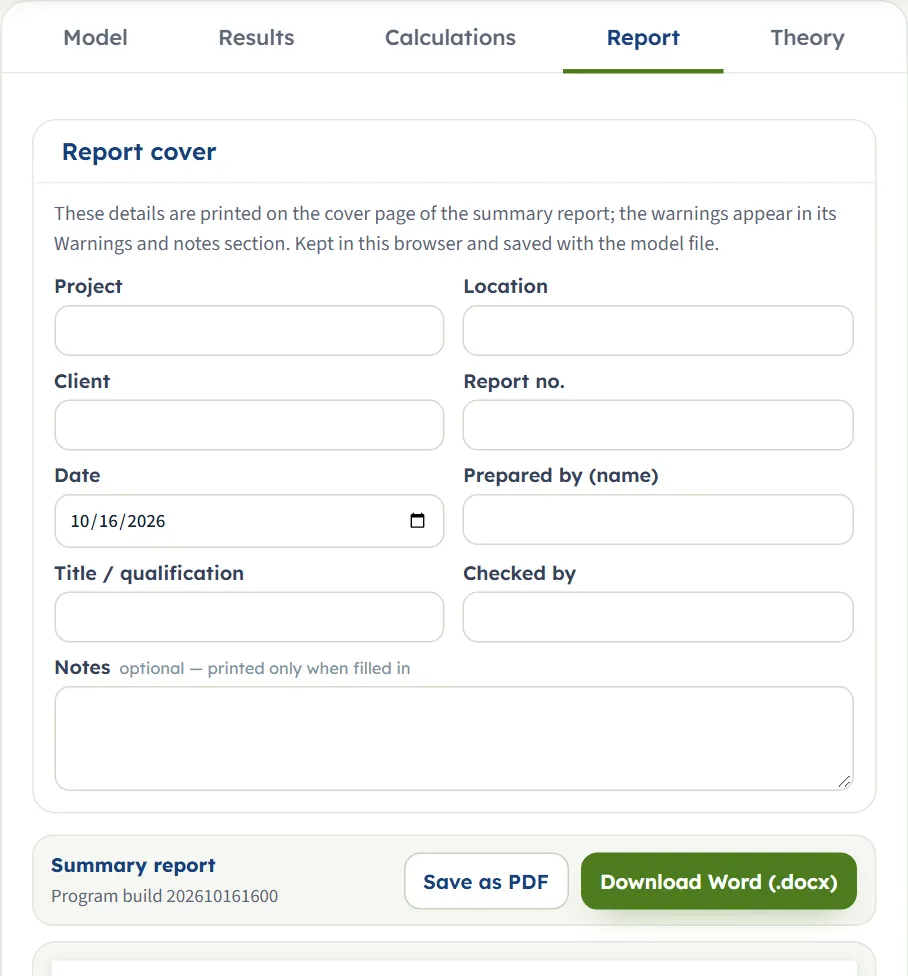
In the Report tab fill in the cover: project, location, client, report no., date, prepared by, title / qualification, checked by, and optional notes. The cover details are kept in this browser and saved with the model file. Save as PDF and Download Word (.docx) produce the report; the preview below is the report itself.
The report has six parts: 1 Introduction and scope, 2 Input data, 3 Calculation, 4 Results, 5 Summary and 6 References. It carries the Section, Pressure, Trial wedges and 3D drawings, the working of every step and the warnings, if any.
The Theory tab
The Theory tab has seven sections, each opening on a click (with Open all and Close all): The pseudo-static wedge; Mononobe–Okabe coefficient; The limit of equilibrium; Line of action; Layers, water and surcharge; Worked example; References.
Worked example: the module’s own example
The module opens on this example, so you can follow the numbers on your own screen.
| Section | Input | Value |
|---|---|---|
| Wall | H, θ | 4 m, 0° |
| Backfill | α | 0° |
| Soil layers | γ, φ′, δ′ | 15.5 kN/m³, 30°, 15° |
| Earthquake | kh, kv | 0.2, 0 |
| Groundwater, Surcharge | None, q = 0 |
Step 1: the seismic angle
ψ = tan⁻¹(0.2 / 1) = 11.31°. The limit kh(cr) = tan 30° = 0.5774, so kh = 0.2 is well inside it.
Step 2: the coefficient
K′a = 0.4520 (the module writes the substituted numbers in the Calculations tab). With kh = 0 the same module gives the static coefficient Ka = 0.3014.
Step 3: the force
Step 4: static and seismic parts, line of action
Pa = ½ × 15.5 × 4² × 0.30141 = 37.38 kN/m, so ΔPae = 56.05 − 37.38 = 18.68 kN/m (from the unrounded values). The line of action: z̄ = (37.38 × 4/3 + 18.68 × 2.4) / 56.05 = 1.689 m above the base.
Step 5: components and critical plane
Pae,h = 56.05 × cos 15° = 54.14 kN/m and Pae,v = 56.05 × sin 15° = 14.51 kN/m, downward on the wall. The critical failure plane is at ηc = 45.32° from the horizontal.
These are the numbers on the Results tab, the six steps of the Calculations tab and the peak of the Trial wedges curve.
The same kind of wall in US units
Switch to US and enter H = 15 ft and γ = 110 pcf with φ′ = 30°, δ′ = 15°, kh = 0.2. The module gives K′a = 0.4520 and Pae = 5.594 kip/ft at z̄ = 6.333 ft; by hand ½ × 110 × 15² × 0.4520 / 1000 = about 5.59 kip/ft.
The same kind of wall in SI · tf
Switch to SI · tf and enter γ = 1.6 t/m³ with the other values of the example: Pae = 5.786 tf/m, ΔPae = 1.928 tf/m, z̄ = 1.689 m. By hand ½ × 1.6 × 4² × 0.4520 = 5.786 tf/m.
A layered model: two layers, water and a surcharge
Add a second layer (γ = 19, γsat = 21, γd = 17 kN/m³, φ′ = 36°, δ′ = 20°), give the first layer a thickness of 2.5 m, put the water table at 2.5 m with Free pore water and enter q = 10 kPa. The module gives Pae = 86.14 kN/m on the back, of which the soil’s seismic increment is ΔPae = 30.80 kN/m, at z̄ = 1.727 m above the base, with Pw = 11.04 kN/m and Pwd = 2.575 kN/m. By hand Pw = ½ × 9.81 × 1.5² = 11.04 kN/m and Pwd = 7/12 × 0.2 × 9.81 × 1.5² = 2.575 kN/m. With Restrained pore water the same model gives Pae = 90.98 kN/m.
How each input changes the answer
Each row changes one thing in the example (H = 4 m, γ = 15.5 kN/m³, φ′ = 30°, δ′ = 15°, kh = 0.2) and runs the module again. The numbers are the ones the module gives, so you can reproduce any row. A dash marks a layered run, which has no single K′a.
| Change | Pae (kN/m) | z̄ (m) |
|---|---|---|
| The example: kh = 0.2 K′a = 0.4520 · ΔPae = 18.68. The reference | 56.05 | 1.689 |
| kh = 0 K′a = 0.3014 · ΔPae = 0. The static Coulomb force: ΔPae = 0 and the line of action at H/3 | 37.38 | 1.333 |
| kh = 0.1 K′a = 0.3679 · ΔPae = 8.244 | 45.62 | 1.526 |
| kh = 0.3 K′a = 0.5626 · ΔPae = 32.38 | 69.76 | 1.829 |
| kh = 0.4 K′a = 0.7178 · ΔPae = 51.64 | 89.01 | 1.952 |
| kh = 0.5 K′a = 0.9715 · ΔPae = 83.10. Close to the limit kh(cr) = 0.5774 | 120.5 | 2.069 |
| kv = +0.1 (upward) K′a = 0.4739 · ΔPae = 15.51. The weight is reduced: the force is less | 52.89 | 1.646 |
| kv = −0.1 (downward) K′a = 0.4351 · ΔPae = 21.97. The force is more | 59.35 | 1.728 |
| φ′ = 25° K′a = 0.5387 · ΔPae = 21.77. Weaker soil: more force | 66.80 | 1.681 |
| φ′ = 35° K′a = 0.3793 · ΔPae = 16.31. Stronger soil: less force | 47.03 | 1.703 |
| δ′ = 0° K′a = 0.4733 · ΔPae = 17.35. A smooth wall: the force is horizontal | 58.68 | 1.649 |
| δ′ = 20° K′a = 0.4540 · ΔPae = 19.42 | 56.29 | 1.701 |
| γ = 18 kN/m³ K′a = 0.4520 · ΔPae = 21.69. K′a unchanged; the force follows γ | 65.09 | 1.689 |
| H = 6 m K′a = 0.4520 · ΔPae = 42.02. The force goes with H²; the line of action with H | 126.1 | 2.533 |
| H = 8 m K′a = 0.4520 · ΔPae = 74.71 | 224.2 | 3.377 |
| θ = +10° (leans toward the backfill) K′a = 0.5416 · ΔPae = 20.24. More force | 67.16 | 1.655 |
| θ = −10° K′a = 0.3799 · ΔPae = 17.71. Less force | 47.11 | 1.734 |
| α = 10° K′a = 0.5619 · ΔPae = 27.12. A rising backfill: more force | 69.67 | 1.749 |
| q = 10 kPa ΔPae = 24.70. Layered form (no K′a card) | 74.13 | 1.797 |
| q = 20 kPa ΔPae = 30.73. The surcharge part doubles | 92.21 | 1.863 |
| Water at 2 m, restrained ΔPae = 40.26. Includes the water on the back | 92.92 | 1.673 |
| Water at 2 m, free ΔPae = 28.52 | 85.69 | 1.527 |
| Water at 5 m (below the base) K′a = 0.4520 · ΔPae = 18.68. No effect on the pressure on the wall | 56.05 | 1.689 |
What the table shows:
- The seismic coefficient raises the force steeply: from 37.38 kN/m at kh = 0 to 120.5 kN/m at kh = 0.5, and the line of action rises from H/3 toward the upper part of the wall.
- The soil matters twice: through γ (the force is proportional to it) and through φ′ (a weaker soil pushes harder).
- The geometry acts through H² and, for the coefficient, through θ and α.
- Water and a surcharge add to the force and move the module to the layered form.
Messages: when the module stops, and cautions
The module checks its inputs and the conditions of the solution. A problem stops the analysis and nothing is calculated; a questionable value only warns and the analysis runs.
Stops
- A value outside its range or empty opens a window titled Cannot analyse — 1 input error (or more), for example “Height of the wall (vertical) (H) must be at least 0.1 m.”, “Height of the wall (vertical) (H) is missing.”, “Effective friction angle (φ′1) must be at most 50°.” or “Horizontal seismic coefficient (horizontal acceleration / g) (kh) must be at least 0.”
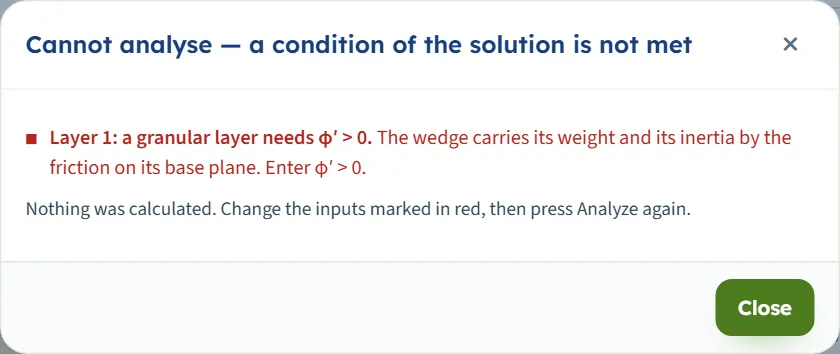
- A condition of the solution that is not met opens a window titled Cannot analyse — a condition of the solution is not met, with the cause, what to do and the line “Nothing was calculated. Change the inputs marked in red, then press Analyze again.”
- The Results tab then says “Press Analyze on the Model tab to calculate the earth pressure.”
| When | Message and what to do |
|---|---|
| kh too large for φ′ and α (for example kh = 0.6 with φ′ = 30°, α = 0) | “Layer 1: the backfill slope α exceeds φ′ − ψ. φ′ − α − ψ = −0.96° < 0 with ψ = 30.96°: the inertia force exceeds what the friction of the soil can carry, so no finite active force exists …” Reduce kh or α, or increase φ′. |
| α steeper than φ′ (for example α = 35°, kh = 0) | “Layer 1: the backfill slope is steeper than φ′. α = 35° > φ′ = 30°: the backfill is not stable even without the earthquake …” Reduce α or increase φ′. |
| φ′ = 0 | “Layer 1: a granular layer needs φ′ > 0. The wedge carries its weight and its inertia by the friction on its base plane.” Enter φ′ > 0. |
| δ′ + θ + ψ ≥ 90° | “Layer 1: no finite active force — δ′ + θ + ψ ≥ 90°. δ′ + θ + ψ = 111.6° ≥ 90° …” Reduce δ′, θ or kh. |
| The back no steeper than φ′ − ψ (for example φ′ = 50°, θ = −40°, kh = 0) | “Layer 1: no active wedge — the back is no steeper than φ′ − ψ. The back rises at 90° + θ = 50° from the horizontal, no steeper than φ′ − ψ …” Increase θ or reduce φ′. |
| Layers above the last already reach the base | “The layers above the last one already reach the base. The last layer would not meet the wall.” Reduce the thicknesses or the number of layers. |
| γsat not above that of water (water present) | “Layer 1: the saturated unit weight 9 kN/m³ is not above that of water.” Enter γsat above 9.81 kN/m³. |
| γd zero or above γsat (free pore water) | “Layer 1: the dry unit weight γd must be above zero and not above γsat.” Enter γd of the layer. |
Cautions
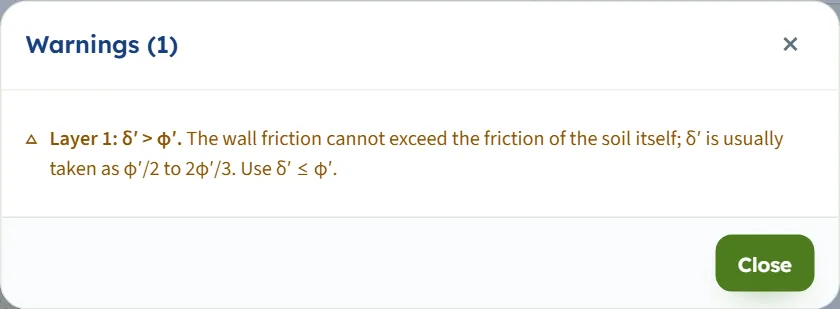
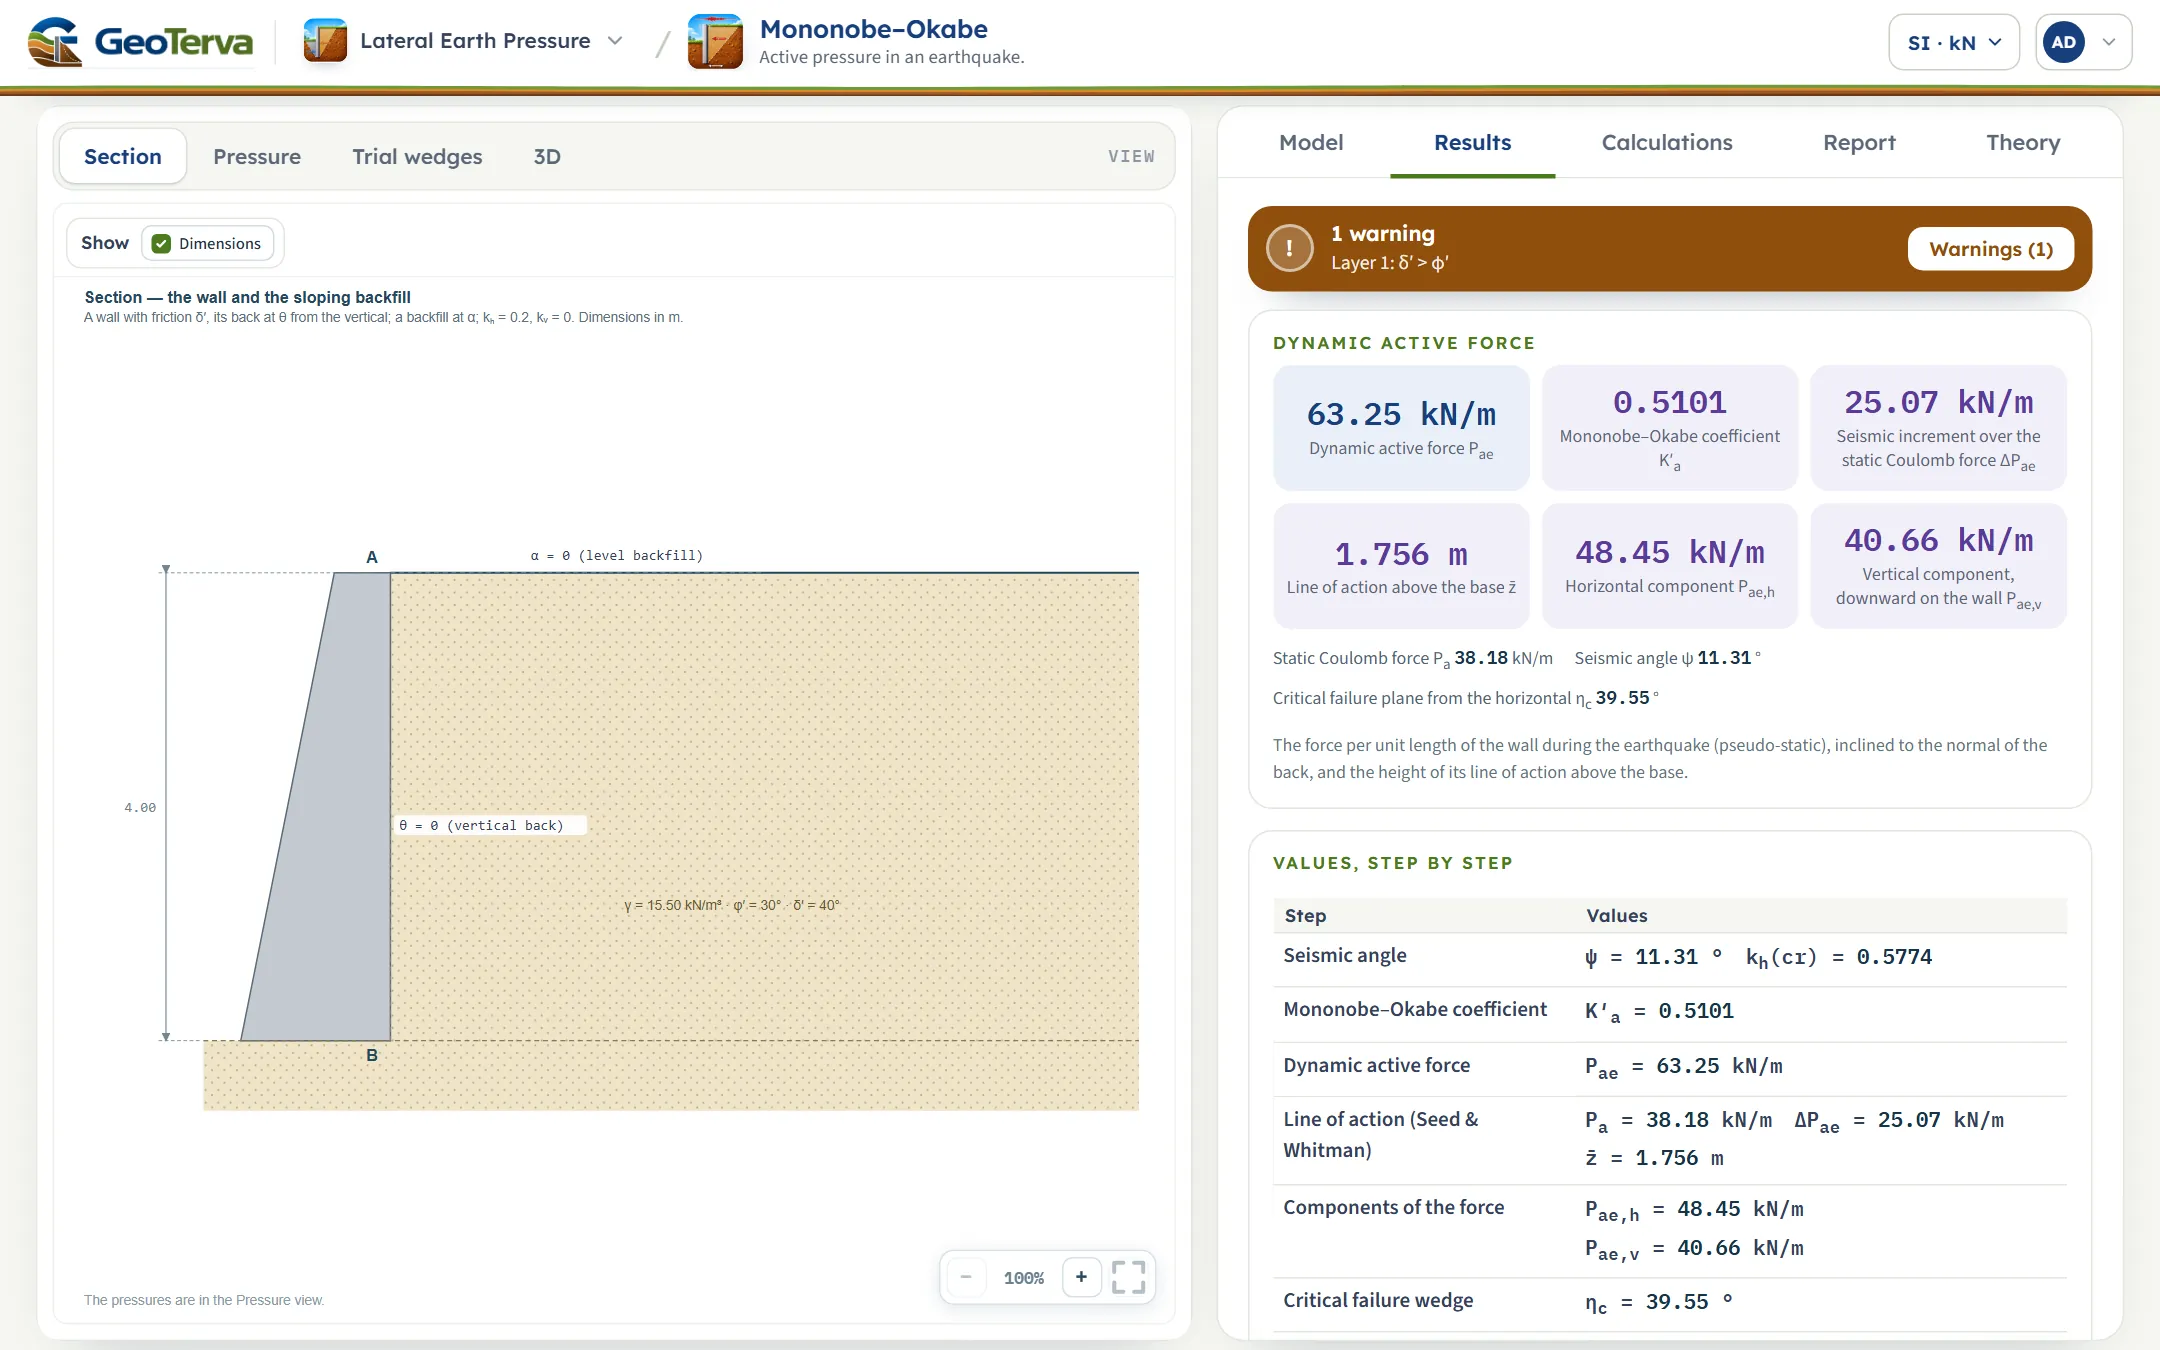
If δ′ is above φ′ the analysis runs and the Results tab shows an orange banner, “1 warning — Layer 1: δ′ > φ′”, and the bar reads Analysed — the earth pressure calculated — 1 warning; a window Warnings (1) opens with “The wall friction cannot exceed the friction of the soil itself; δ′ is usually taken as φ′/2 to 2φ′/3. Use δ′ ≤ φ′.” The Warnings (n) button reopens it, and the warnings are printed in the report.
Good practice and common mistakes
- Choose kh and kv from your design basis. The module takes them as given and stops only where no solution exists; the force rises steeply as kh approaches the limit kh(cr).
- Check the static case first. Set kh = 0: the module returns the static Coulomb force, the part of the answer that does not come from the earthquake.
- Keep δ′ at or below φ′ (usually φ′/2 to 2φ′/3); above φ′ the module warns.
- Enter thicknesses vertically at the back. The last layer has none: it runs on below the heel.
- Match the pore-water case to the soil. Restrained for soils of low permeability, free for clean gravels and coarse sands; compare both with the (?) window.
- Read Pae per unit length and in its direction: inclined to the normal of the back, with the horizontal and vertical components given.
- Use the module for the pressure only. The wall’s own weight, the passive resistance and the other actions belong to your stability checks.
- Your typed values are kept in the browser; save the model to a file to keep it with the project, and use the report as the record of an analysis.
- Check the units after switching the system: type values in the units shown beside the boxes.
Frequently asked questions
What does the Mononobe–Okabe module calculate?
The active force on a retaining wall during an earthquake by the pseudo-static method: Pae = ½ γ H² (1 − kv) K′a for one soil, with K′a from φ′, δ′, θ, α and the seismic angle ψ. For the module’s example it gives K′a = 0.4520 and Pae = 56.05 kN/m.
Where do I get kh and kv?
From your design basis. The module takes kh (0 to 0.9) and kv (−0.5 to 0.5) as inputs and does not derive them.
What is the difference between Pae and the static Coulomb force?
The static Coulomb force Pa is the active force with kh = kv = 0; ΔPae = Pae − Pa is the seismic increment. In the example Pa = 37.38 kN/m and ΔPae = 18.68 kN/m.
Where does the force act?
The line of action is z̄ above the base, with the static part at H/3 and the seismic increment at 0.6H; in the example z̄ = 1.689 m of 4 m. The module notes that the split is approximate.
Why does the module stop with “the backfill slope α exceeds φ′ − ψ”?
The seismic angle ψ grows with kh, and the soil can carry the inertia only while α ≤ φ′ − ψ. For a level backfill that means kh ≤ (1 − kv) tan φ′, which is 0.5774 for φ′ = 30°. Reduce kh or α or increase φ′.
Can I use layers, water and a surcharge?
Yes: up to six granular layers, a level water table with restrained or free pore water, and a uniform surcharge. The module then uses its layered form, where each layer takes its own coefficient.
What is the difference between restrained and free pore water?
Restrained water moves with the soil, so the saturated mass carries inertia; free water, in a highly permeable backfill, does not, so only the dry mass does, and the water adds a hydrodynamic pressure. The (?) window gives the force for both cases on your model.
Does it include cohesion?
No. The soil is granular, c′ = 0; a layer needs φ′ above 0.
Why are there no trial wedges with layers or water?
The Trial wedges view is drawn for one soil without water or surcharge. With layers, water or a surcharge each layer takes its own coefficient, and the Calculations tab and the report list them.
Does the module remember my inputs?
Yes. Every change is kept in this browser, so the page opens on the model you last worked on; Reset to defaults returns to the example, and Save to file or Quick Save keeps a version of a model.
Can I drag things on the drawing?
No value can be dragged; every value is typed in the Model tab and the drawing follows. Zoom with the buttons or the wheel, drag the background to pan when zoomed, and use the square button to fit it.
What units does it use, and what does the report contain?
SI · kN, SI · tf or US, switchable at any time, even after Analyze (forces in kN/m, tf/m or kip/ft). The report has a cover and six parts: introduction and scope, input data, the calculation step by step, results, summary and references, with the four drawings, as a PDF or a Word file after Analyze.