

What the module calculates
Ramp load gives the extra horizontal pressure on a wall from a long surface load that runs parallel to it and rises like a ramp: the load is zero at a distance x from the wall, rises in a straight line to its full intensity q at x + c, and stays at q beyond. It draws the pressure on the wall and gives its resultant PH (a force per unit length of wall), the depth zR at which the resultant acts below the ground, and the peak pressure σH,max .
The pressure at a depth z comes from adding up the elastic stresses of the line loads that make up the ramp and the plateau, which has a closed form:
R1 and R2 are the distances from the point on the wall to the start and to the end of the ramp, α and β are the two angles they make, and ψ is 2 for a wall that does not yield or 1 for a wall that deflects (see Choosing the method). The resultant PH is the area of the pressure diagram over the wall height H, and zR is the depth of its centroid.
What you can describe
- A wall of height H, with the ground level with its top.
- A ramp load that starts a distance x from the wall (it can start at the wall, x = 0), rises over a width c and continues at the plateau intensity q.
- Two methods: Elastic · rigid wall and Elastic · half-space.
- The load is long and parallel to the wall, so every result is per unit length of wall.
What belongs to other modules
- This module gives the pressure from one ramp load. The other loads of the family have a manual of their own: Point load, Strip load, Line load, Triangular load, Uniform load and Area loads.
- The result is the pressure that the load adds. The pressure of the soil itself, the water and any other action on the wall are combined with it in your own analysis of the wall.
- The module asks for no soil properties: the elastic solution does not use them.
Before you start: what you need
Have these four numbers and one decision ready:
| What | Where it comes from | Notes |
|---|---|---|
| Wall height H | Your design | The pressure is worked out from the ground surface down to this depth. It must be greater than zero. |
| Distance x from the wall to the start of the ramp | The layout of the load | Zero or more. x = 0 puts the foot of the ramp at the wall. |
| Ramp width c | The layout of the load | Greater than zero. The load reaches its full value q at x + c from the wall. |
| Plateau intensity q | Your loading | Zero or more. The intensity beyond the ramp; the ramp rises to it from zero. |
| Wall behaviour | Your design | Rigid wall (a wall that does not yield) or half-space (a wall that deflects). It sets ψ = 2 or 1. |
Quick start in seven steps
- Open the module and choose the units
Open Ramp load from the Surcharge Loads family. Pick SI · kN, SI · tf or US in the header; you can change it at any time. Open Ramp load.
- Describe the wall and the ramp
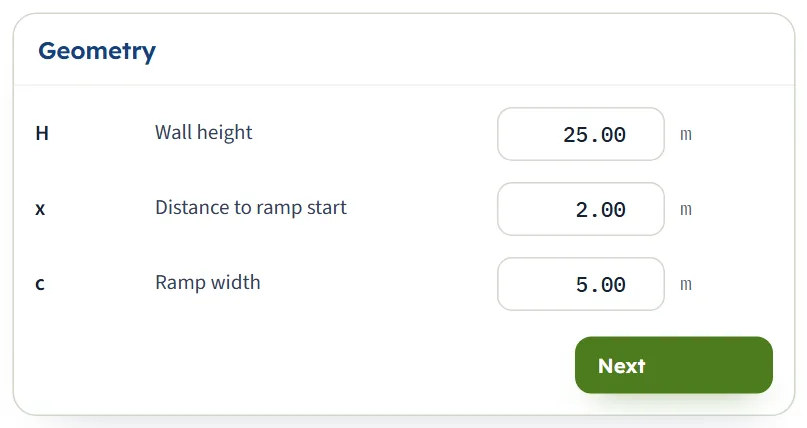
In Geometry, enter the wall height H, the distance x from the wall to the start of the ramp and the ramp width c. The drawing follows each number, and you can drag the load instead of typing x and c.
- Enter the plateau intensity
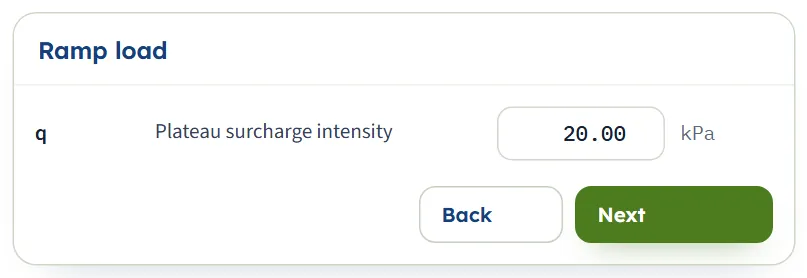
In Ramp load, enter q, the intensity the ramp rises to and keeps beyond x + c.
- Choose the method
In Method, pick Elastic · rigid wall (the default, for a wall that does not yield) or Elastic · half-space (for a wall that deflects). The (?) beside each opens a window with a sketch and the formula.
- Press Analyze
Press Analyze at the foot of the Model tab. The bar turns green and reads Analysed, the inputs lock, and the drawings show the pressure on the wall and its resultant.
- Read the answer
The Results tab gives the resultant force PH, its depth zR and the peak pressure with its depth. The Calculations tab writes out the working.
- Take the report
In the Report tab fill in the cover and press Save as PDF or Download Word (.docx).
The screen: views, chips and dragging
The layout is the one every GeoTerva module shares, described in the workspace guide: the drawing on the left, the five tabs on the right. This module’s Model tab is shorter than most: it has three sections (Geometry, Ramp load and Method) and no Model data section. Your values are not kept when you close the page, so keep a note of them or save the report; the unit system you choose and the cover details of the Report tab are remembered by the browser.
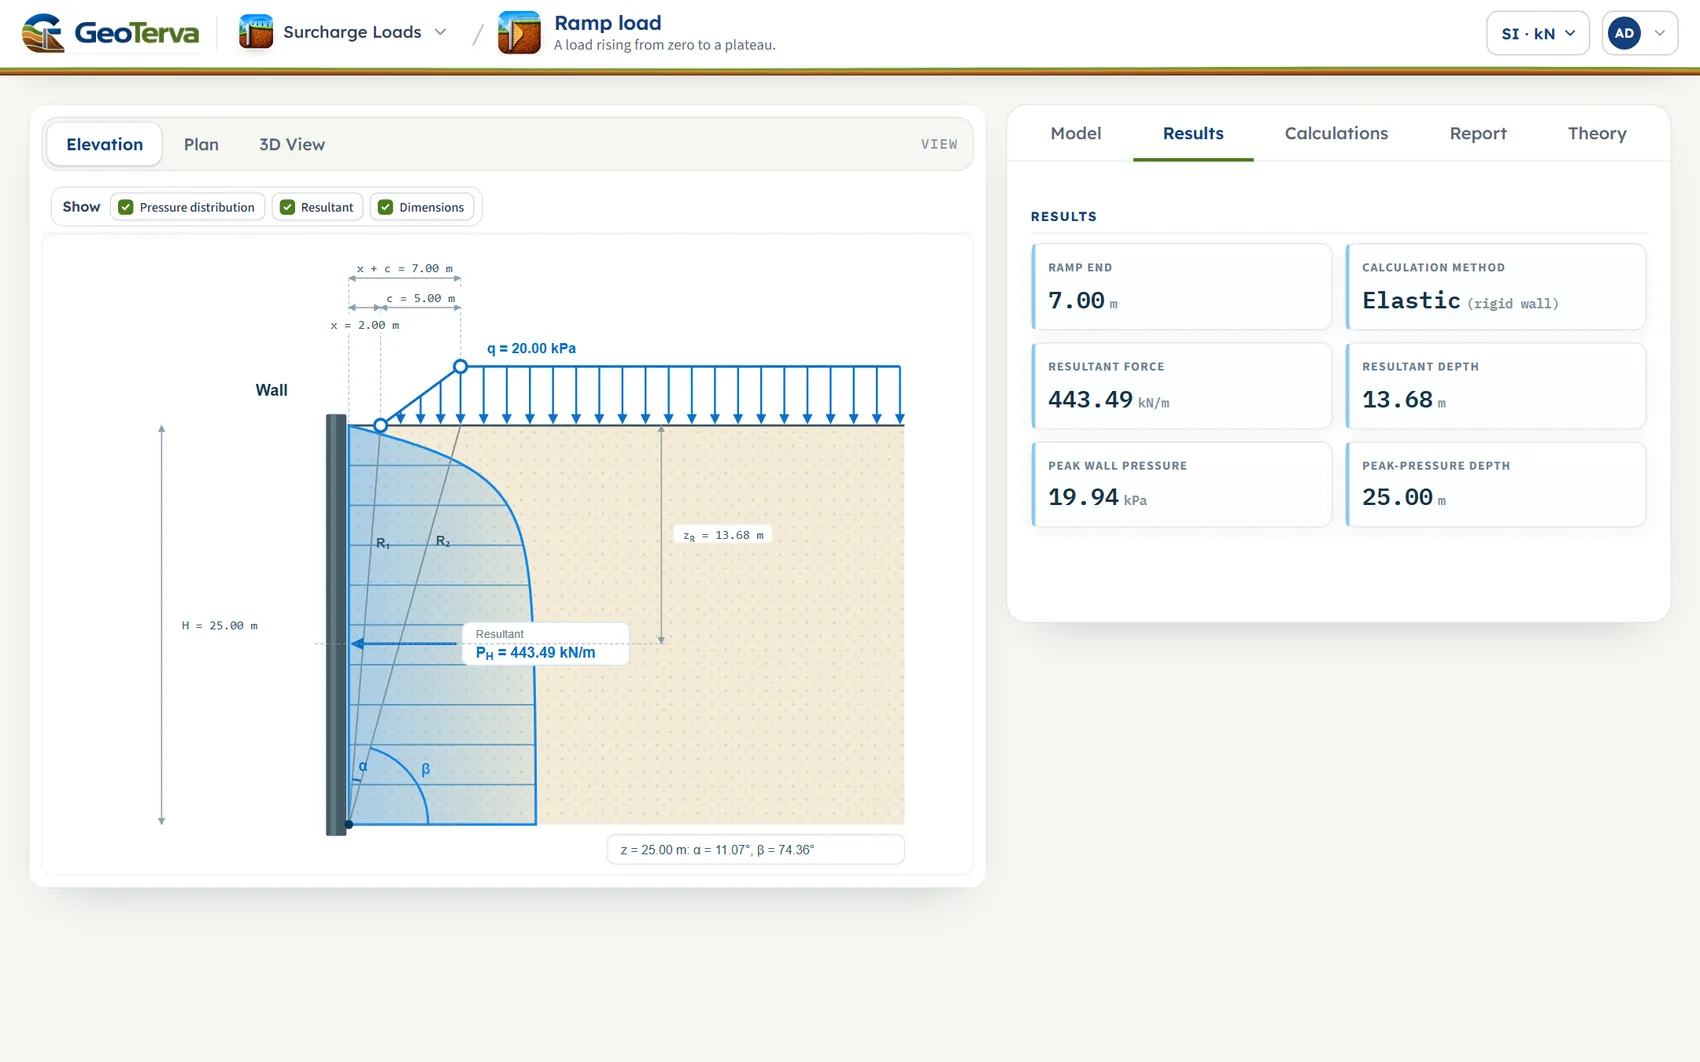
- Family menu. Opens the list of the seven Surcharge Loads modules.
- Units. SI · kN, SI · tf or US; it can be changed at any time, also after Analyze.
- Account menu.
- Views. Elevation, Plan and 3D View.
- Show chips. Pressure distribution, Resultant and Dimensions.
- The knee of the ramp. The hollow dots on the load are its drag handles.
- The pressure on the wall, with its resultant.
- The five tabs. Model, Results, Calculations, Report and Theory.
- The results. Six cards.
The three views
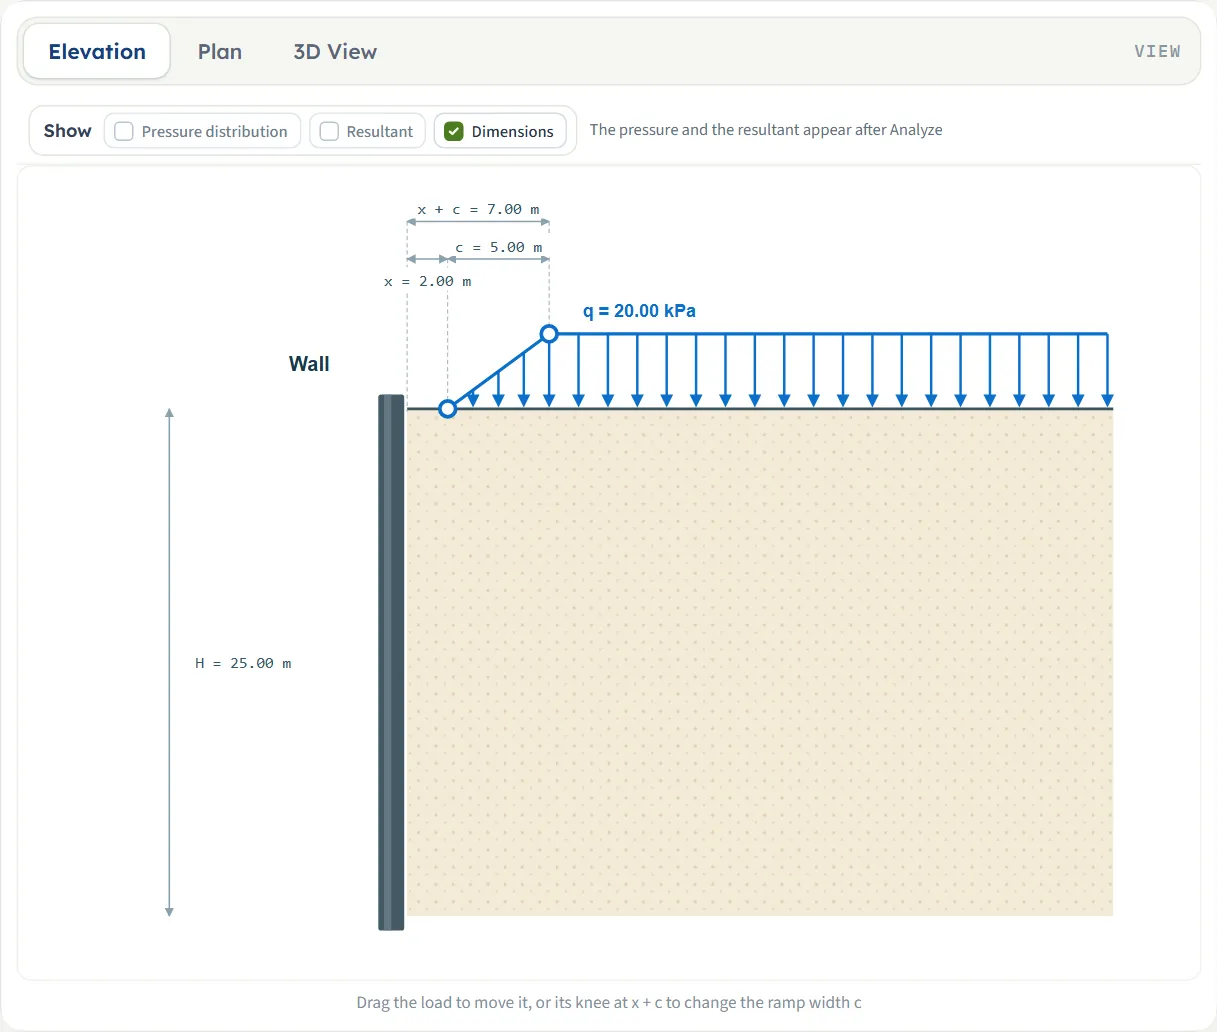
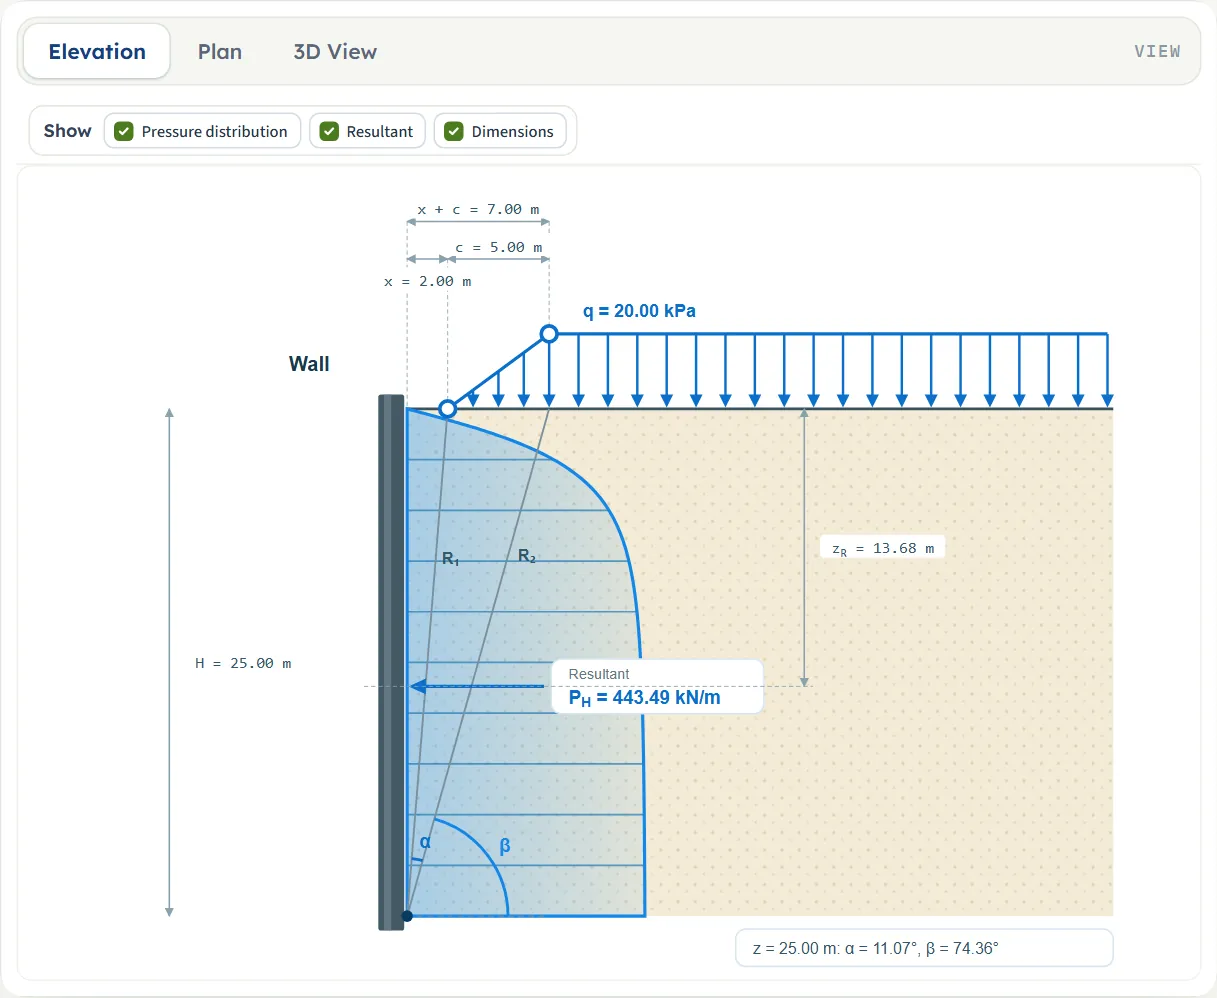
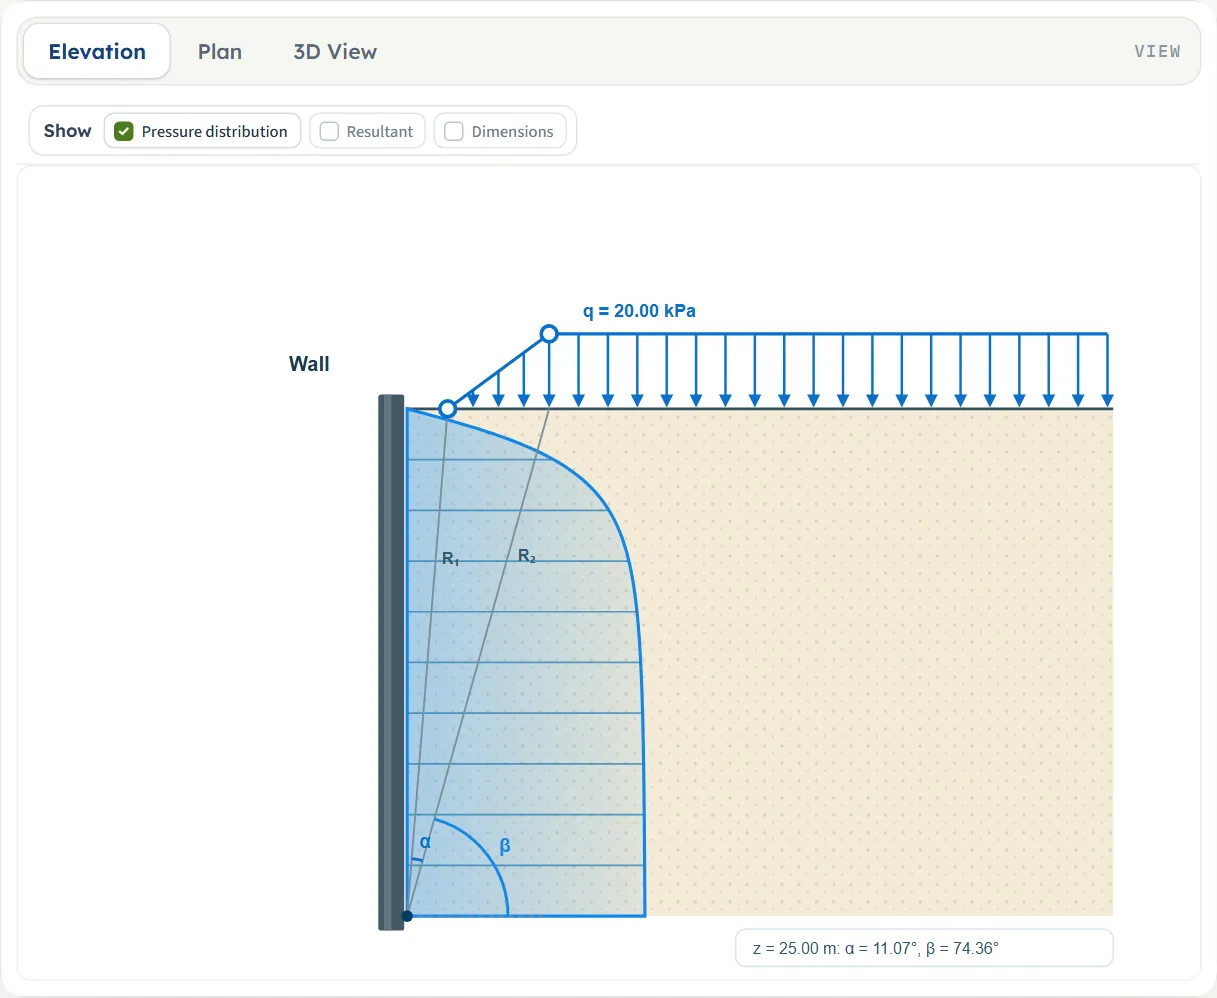
- Elevation is the section through the wall: the wall, the ground, the ramp and plateau drawn as a load with arrows, the distance chain wall → x → x + c, and the wall height H. After Analyze it adds the pressure diagram on the wall with ordinate lines, the rays R1 and R2 and the angles α and β at the depth of the peak pressure (with a line that reads their values), and the resultant as an arrow with PH and the depth zR.
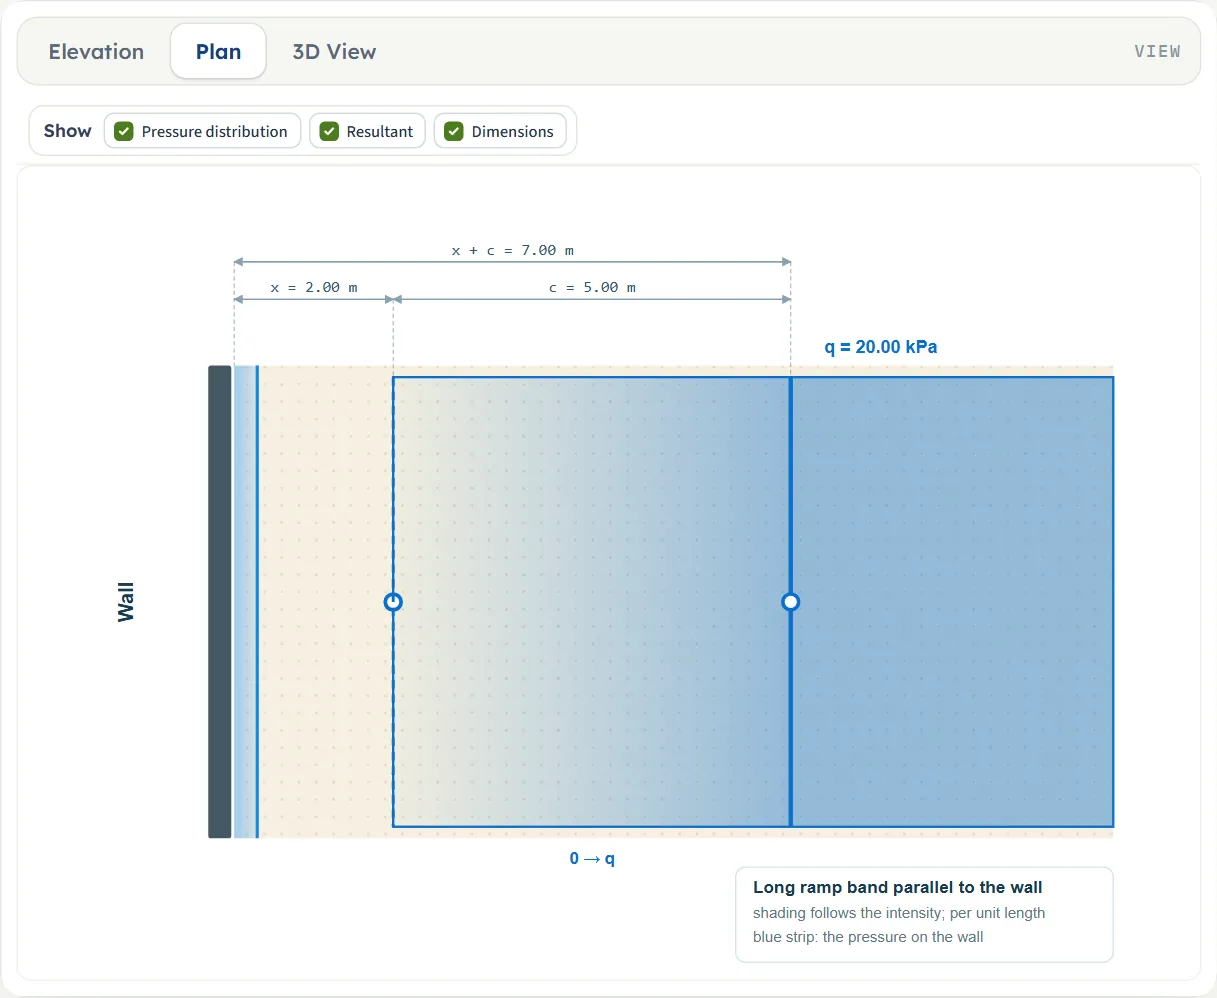
- Plan looks down on the ground: the wall as a bar on the left, the ramp as a band whose shading follows the intensity from 0 to q, and the same edge distances. After Analyze a blue strip along the wall is the pressure on it.
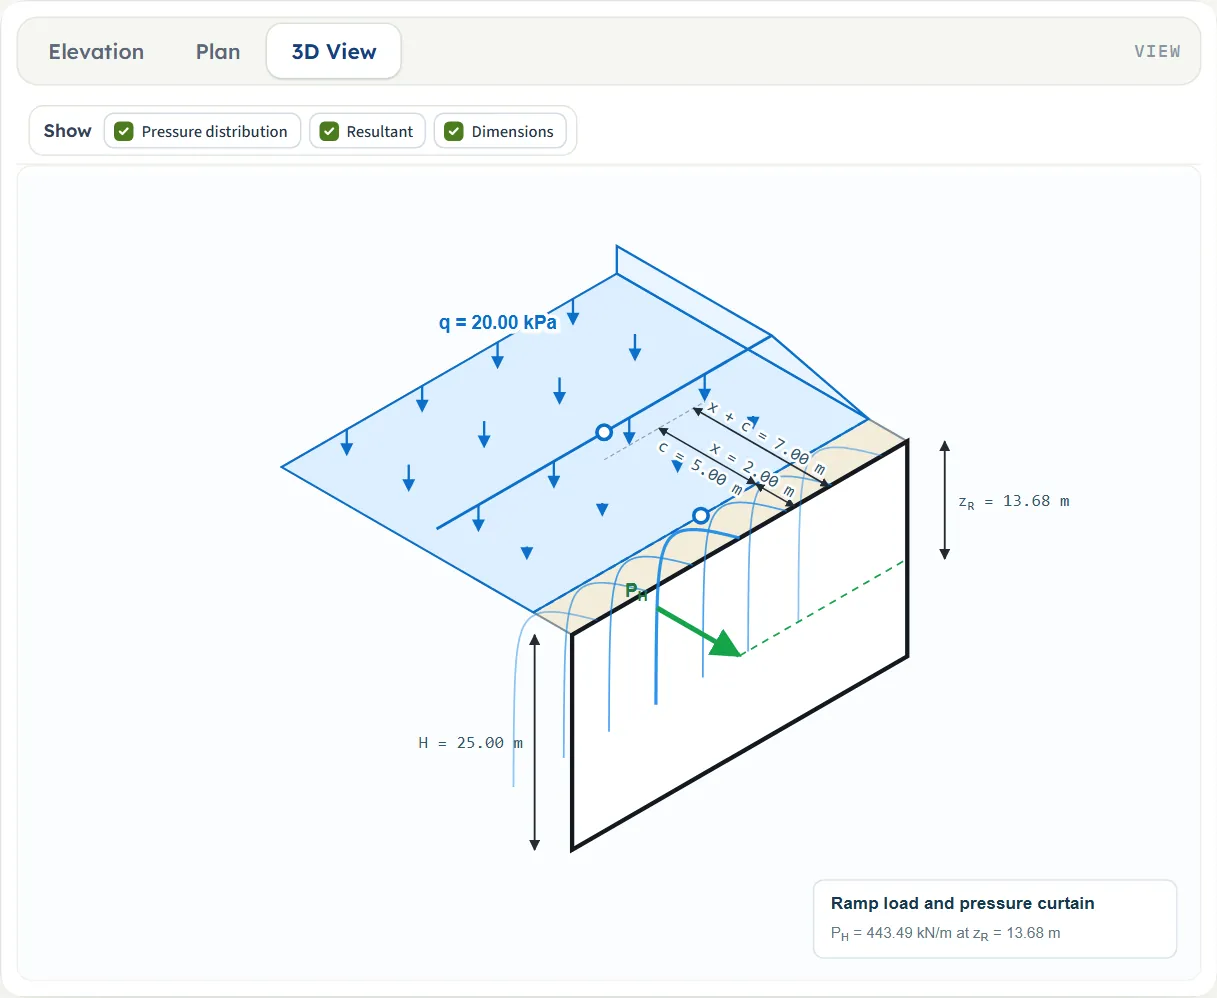
- 3D View shows the wall, the ramp rising to its plateau and, after Analyze, the pressure curtain on the face of the wall with the resultant as an arrow at its depth.
Before Analyze a drawing is the geometry alone, so you can check the layout against your plans: the load, its value over the arrows, the distances and the wall height. The pressure and the resultant appear after Analyze.
After Analyze the view carries the pressure diagram, the construction lines that explain it, and the resultant.
The Show chips
The chips above the drawing choose what is drawn. Pressure distribution and Resultant are available after Analyze and are on when it finishes (the resultant is drawn in the Elevation and 3D views). Dimensions switches every dimension line and its label, and can be used before Analyze too.
Dragging the load
Under the drawing the module says: “Drag the load to move it, or its knee at x + c to change the ramp width c”. Both handles are hollow dots on the load, in all three views.
- The start (the dot at the foot of the ramp, or anywhere on the load) moves the whole load: x changes, c and q stay.
- The knee (the dot where the ramp reaches q) changes the ramp width c; the start stays where it is.
- The boxes in the Model tab follow the pointer. Values go in steps of 0.05 in the unit shown; x cannot go below zero and c cannot go below 0.05.
- The handles move within the ground that is drawn. In 3D View the pointer is followed along the slanted line that leads away from the wall.
- After Analyze the inputs are locked, the hint disappears and the handles no longer move the load. Edit inputs unlocks them.
Entering the model, section by section
The Model tab has three sections. The one you are working on is highlighted and carries Back and/or Next (Next on the first section, Back on the last); the other two stay in view. Boxes accept any number; a value that breaks a rule is reported at once by a message (see Messages). The unit shown beside each box follows the unit system in the header; the defaults below are shown in the three systems.
Geometry
The wall and where the load stands in relation to it. All three are lengths.
| Field | Symbol | Unit | Default | What to enter |
|---|---|---|---|---|
| Wall height | H | m · ft | 25 m (82.02 ft) | Greater than zero. The depth over which the pressure diagram and its resultant are worked out; the ground is level with the top of the wall. |
| Distance to ramp start | x | m · ft | 2 m (6.56 ft) | Zero or more. The horizontal distance from the wall to the foot of the ramp, where the load is zero. |
| Ramp width | c | m · ft | 5 m (16.40 ft) | Greater than zero. The horizontal width over which the load rises from zero to q. The load is at q from x + c outwards. |
Ramp load
The intensity of the plateau.
| Field | Symbol | Unit | Default | What to enter |
|---|---|---|---|---|
| Plateau surcharge intensity | q | kPa · t/m² · ksf | 20 kPa (2.04 t/m², 0.4177 ksf) | Zero or more. The intensity the ramp rises to at x + c and keeps beyond. |
Method
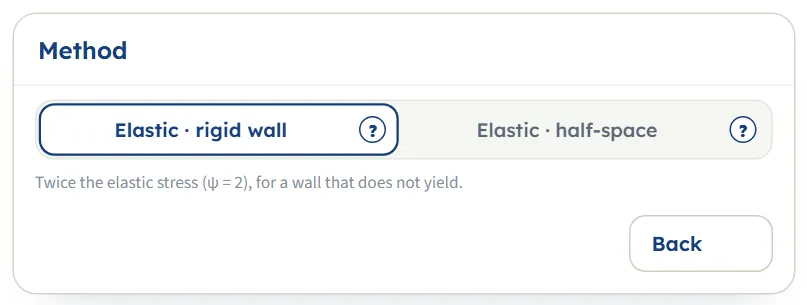
Two buttons choose the solution. Under them the module repeats what the chosen one means: “Twice the elastic stress (ψ = 2), for a wall that does not yield.” for the rigid wall, and “The elastic stress in a half-space (ψ = 1), as if the wall were absent — for a wall that deflects.” for the half-space. A (?) beside each button opens its help window.
| Choice | Options | Default |
|---|---|---|
| Calculation method | Elastic · rigid wall Elastic · half-space | Elastic · rigid wall |
Units
The header selector switches between SI · kN (m, kPa, kN/m), SI · tf (m, t/m², tf/m) and US (ft, ksf, kip/ft). The boxes, the drawings, the cards and the report all follow it. The example in the three systems gives PH = 443.49 kN/m, 45.22 tf/m and 30.39 kip/ft; the model itself does not change.
Choosing the method
Both methods use the same ramp load and the same expression; they differ in the factor ψ that scales it, and so in what they say about the wall.
| Method | ψ | What it assumes | Result on the example |
|---|---|---|---|
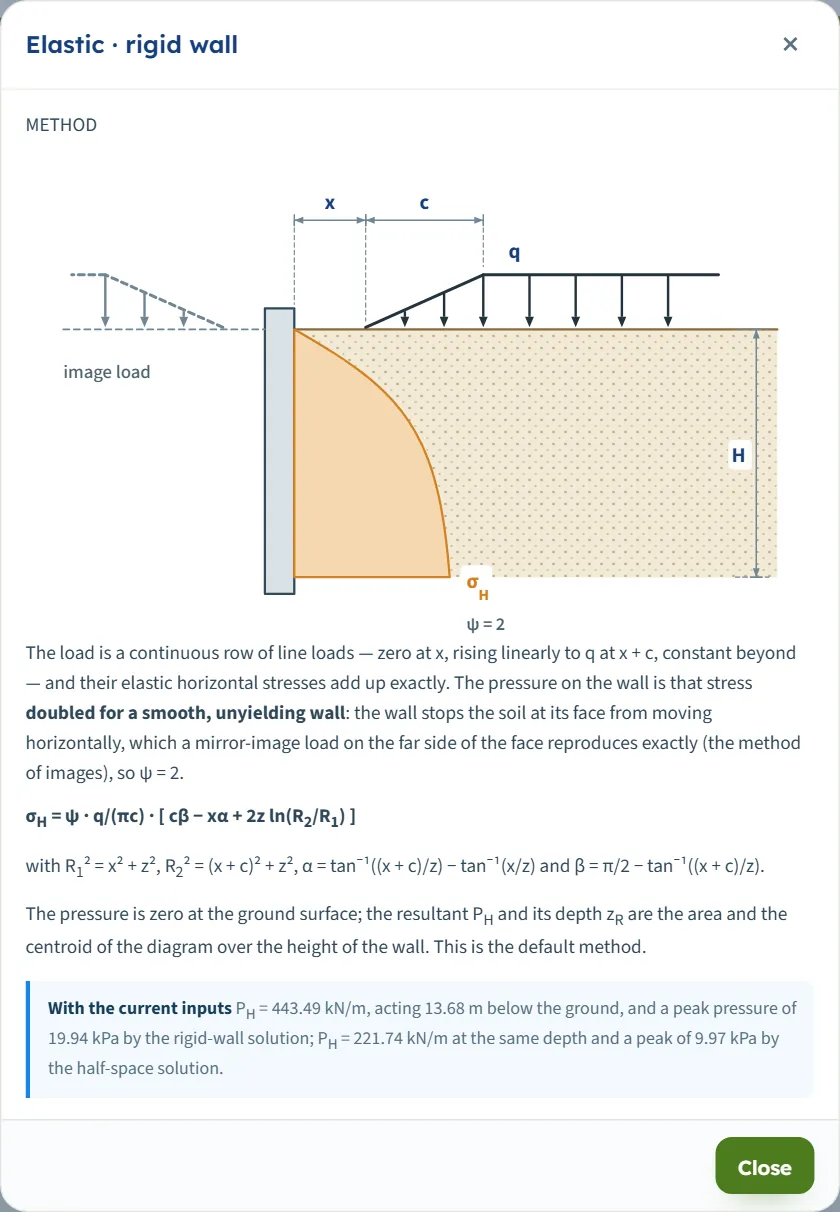
| Elastic · rigid wall (default) | 2 | A smooth, unyielding wall: it stops the soil at its face from moving horizontally. The module reproduces this with a mirror-image load on the far side of the face (the method of images), so the pressure on the wall is the half-space stress doubled. | PH = 443.49 kN/m |
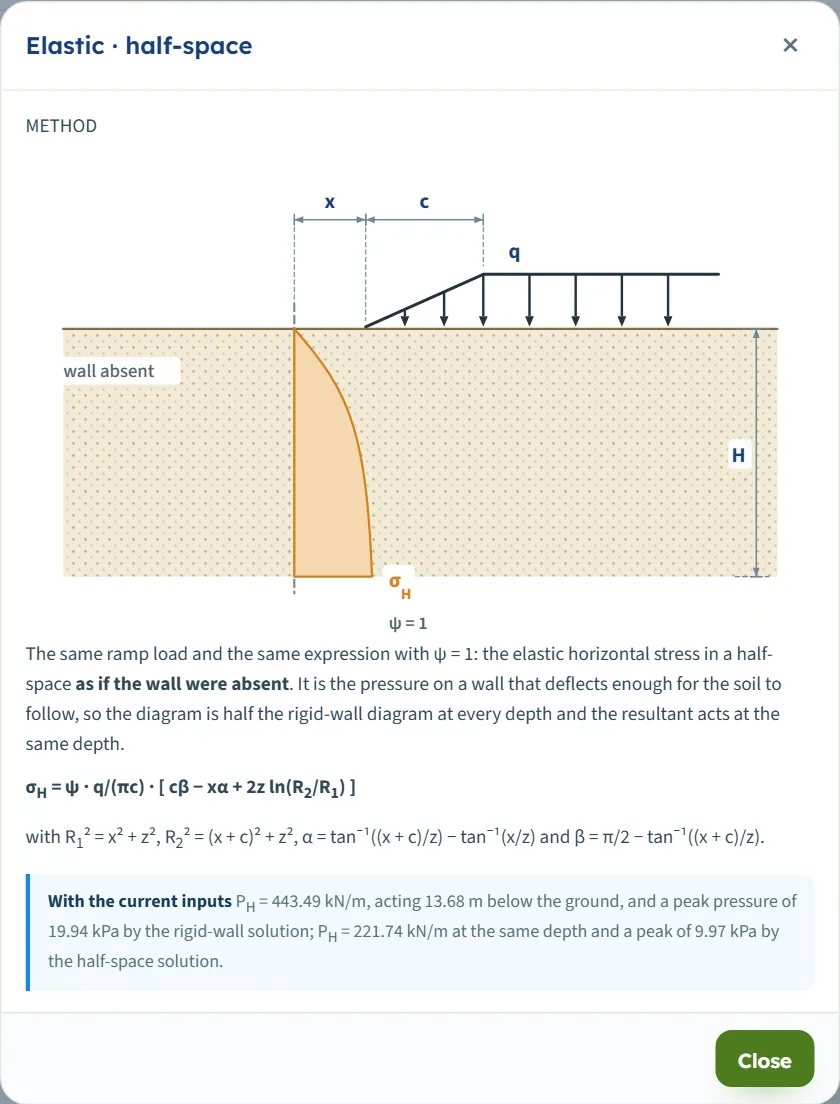
| Elastic · half-space | 1 | A wall that deflects enough for the soil to follow, so the pressure on it is the elastic stress in a half-space as if the wall were absent. | PH = 221.74 kN/m |
The half-space diagram is half the rigid-wall diagram at every depth and the resultant acts at the same depth. On the example zR is 13.68 m in both, and the peak pressure is 19.94 kPa for the rigid wall and 9.97 kPa for the half-space.
The (?) beside a method opens its help window: a sketch of the ramp beside the wall with the pressure diagram on the face (for the rigid wall also the image load), the formula with R1, R2, α and β, and a line headed With the current inputs that gives PH, zR and the peak pressure for both methods on your numbers.
The help window of the half-space method has the same layout: the same ramp, with the label “wall absent”, the pressure diagram on the plane of the wall at half the width, and the same line With the current inputs.
Which should I pick?
- Rigid wall is the module’s default and the one for a smooth, unyielding wall: a wall that does not yield.
- Half-space is for a wall that deflects enough for the soil to follow.
- Compare the two. They differ by a factor of two on the pressure and its resultant; the depth of the resultant is the same. Run one, then press Edit inputs, switch the method and run again.
Analyze and read the results
Press Analyze. The bar at the foot of the Model tab turns green and reads Analysed — the lateral pressure calculated; the inputs and the method buttons lock, and the unit system can still be changed. Edit inputs clears the results and unlocks the model.
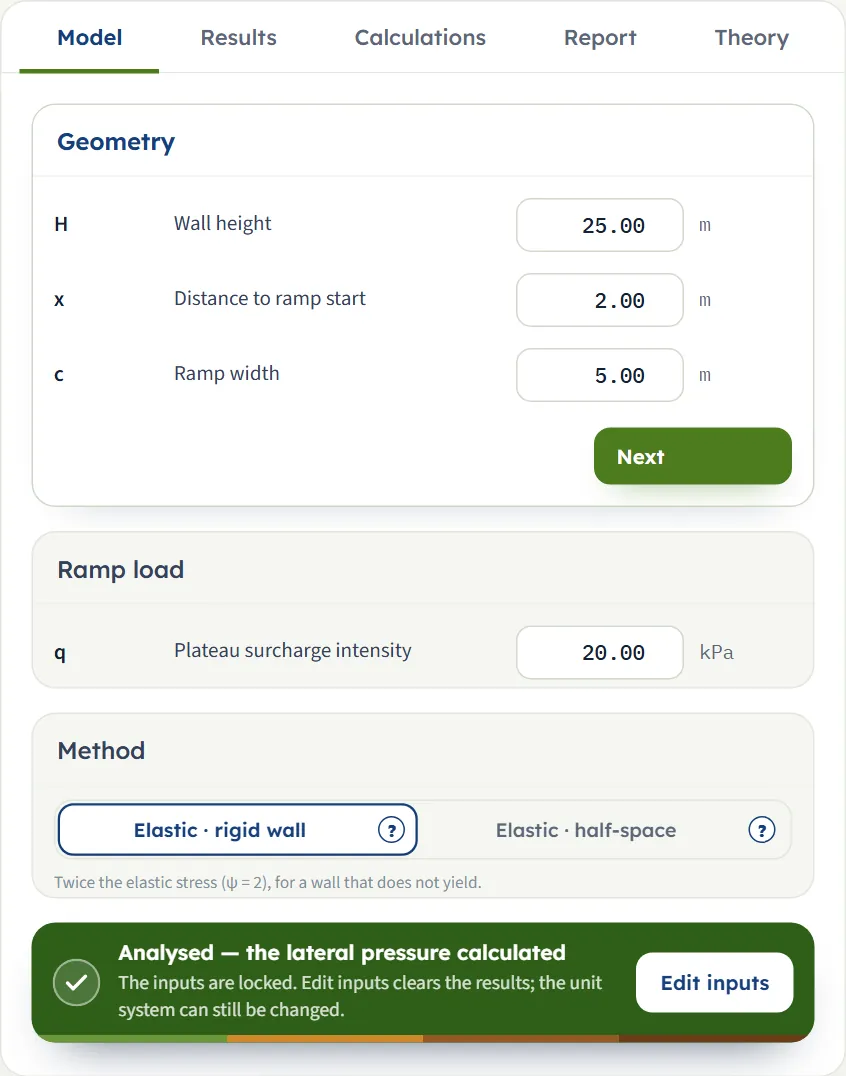
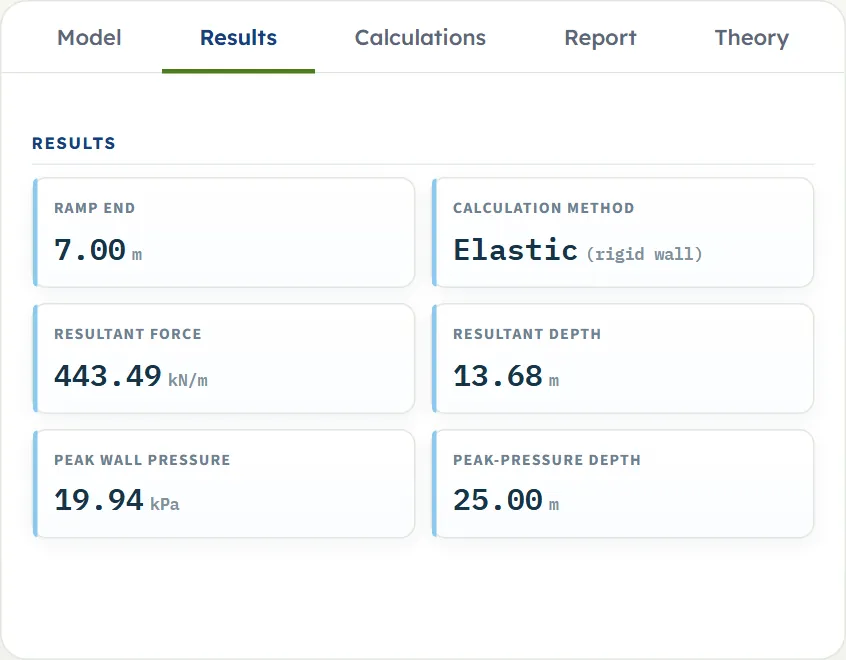
The Results tab shows six cards:
- Ramp end: x + c, where the load reaches q.
- Calculation method: Elastic, with the wall behaviour in brackets.
- Resultant force: PH, the area of the pressure diagram, per unit length of wall.
- Resultant depth: zR, below the ground.
- Peak wall pressure: the largest ordinate of the diagram, σH,max .
- Peak-pressure depth: where that ordinate is.
Reading the numbers
- PH is a force per unit length of wall (kN/m, tf/m or kip/ft).
- zR is measured down from the ground. The Calculations tab also gives the height above the base: on the example zR = 13.68 m below the ground, 11.32 m above the base.
- The resultant lies below mid-height of the wall (12.50 m on the example) because the pressure grows with depth.
- In every run of this page that has a load the largest pressure is at the base of the wall, so the peak-pressure depth equals H; the card tells you where it is for your own geometry.
The Pressure profile
The table “Pressure profile, every H/30” in the Calculations tab lists the ordinates at 31 depths, from the ground to the base in 30 equal steps of H, with the rays and angles behind each.
The Calculations tab and the report
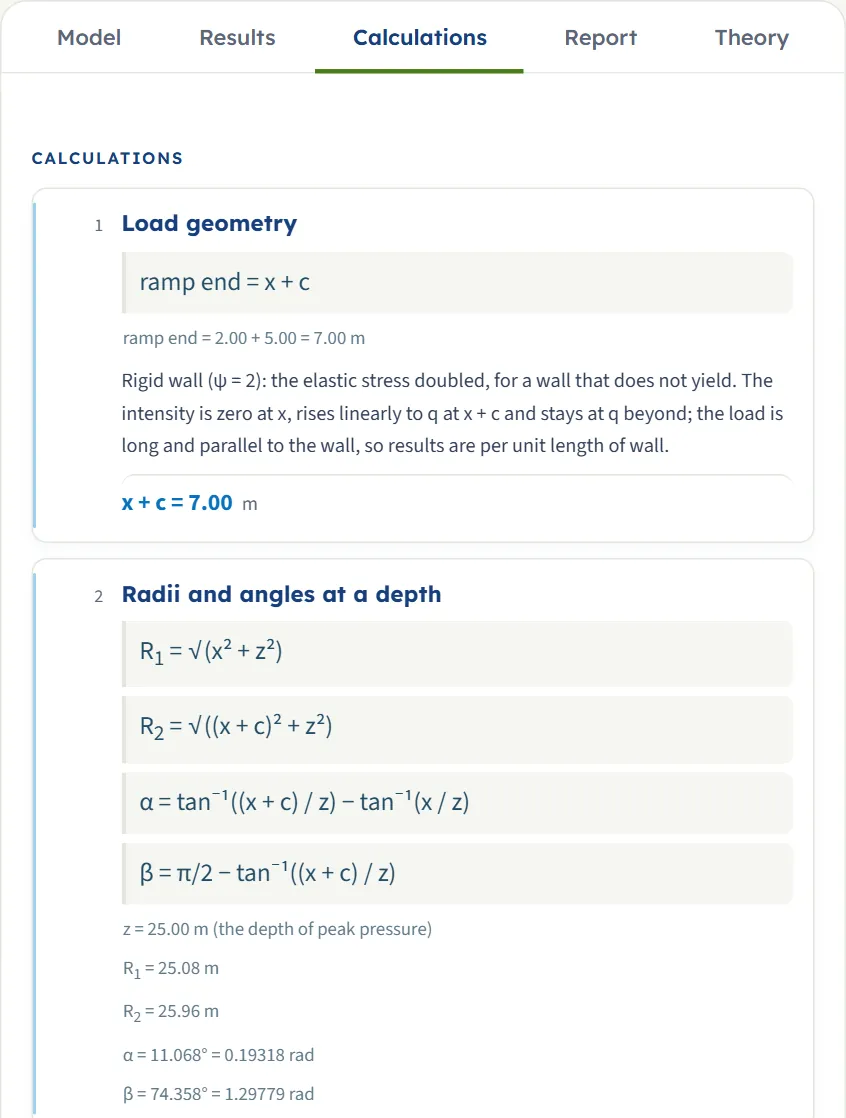
The Calculations tab writes out the working in four steps:
- Load geometry — the ramp end x + c and what the chosen method means (ψ = 2 or 1).
- Radii and angles at a depth — R1, R2, α and β with their numbers, at the depth of the peak pressure (z = 25.00 m on the example).
- Horizontal pressure — the equation with your numbers put in and the answer σH,max , followed by the table Pressure profile, every H/30: z, R1, R2, α (°), β (°) and σH at 31 depths from the ground to the base.
- Resultant and its depth — PH and zR, with zR also given above the base.
The Report tab
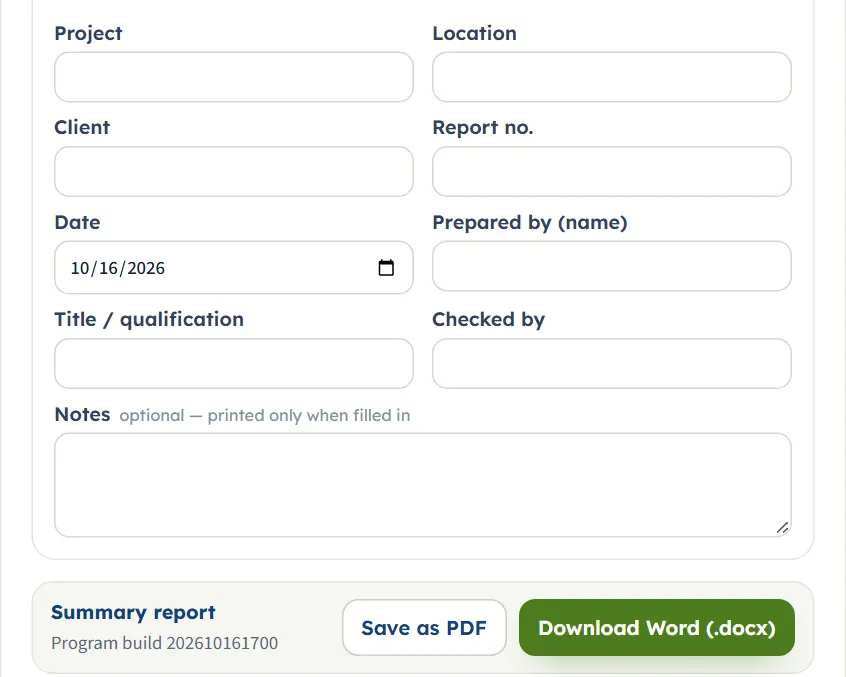
The Report tab fills in a cover page and builds a summary report from the same working. The cover has Project, Location, Client, Report no., Date, Prepared by (name), Title / qualification, Checked by and an optional Notes box that is printed only when it is filled in. Press Save as PDF or Download Word (.docx).
The report has six parts: 1 Introduction and scope, 2 Input data (with the elevation, plan and 3D drawings as figures), 3 Calculation (the four steps and the pressure profile), 4 Results, 5 Summary and 6 References. It states the resultant to four significant figures, for example PH = 443.5 kN/m, and its Summary closes with a sentence that puts PH, zR and the peak pressure in words.
The Theory tab explains the method in six numbered sections: Ramp load on a wall, Radii and angles, Horizontal pressure, Resultant and line of action, Worked example and References. Each section opens and closes, and Open all and Close all do it for the lot. Its worked example is fixed on the numbers of the module’s example and does not follow your inputs.
Worked example: the module’s own example
The module opens on this example, so you can follow every number on your own screen.
| Section | Input | Value |
|---|---|---|
| Geometry | Wall height | H = 25 m |
| Geometry | Distance to ramp start | x = 2 m |
| Geometry | Ramp width | c = 5 m |
| Ramp load | Plateau surcharge intensity | q = 20 kPa |
| Method | Calculation method | Elastic · rigid wall, ψ = 2 |
Step 1: the geometry
The ramp ends at x + c = 2.00 + 5.00 = 7.00 m, as the Ramp end card says. The load is zero at 2 m from the wall, rises in a straight line to 20 kPa at 7 m and stays at 20 kPa beyond.
Step 2: the pressure at 5 m depth, by hand
At z = 5.00 m the two rays have lengths R1 = √(2² + 5²) = 5.385 m and R2 = √(7² + 5²) = 8.602 m. The angles are α = tan⁻¹(7/5) − tan⁻¹(2/5) = 54.462° − 21.801° = 32.661° = 0.57004 rad and β = 90° − 54.462° = 35.538° = 0.62025 rad. Then
The table “Pressure profile, every H/30” in the Calculations tab has this depth in its row for 5.00 m: R1 5.39, R2 8.60, α 32.661°, β 35.538° and σH 16.92 kPa. With the half-space method ψ = 1 and the ordinate is half of it, 8.46 kPa.
Step 3: the pressure at the base
The Calculations tab works the equation at the depth of the peak pressure, z = 25.00 m: R1 = 25.08 m, R2 = 25.96 m, α = 11.068° = 0.19318 rad, β = 74.358° = 1.29779 rad, and
Step 4: the resultant and its depth
The module integrates the diagram over the 25 m: PH = 443.49 kN/m, acting at zR = 13.68 m below the ground (11.32 m above the base). A quick check on the size of the number: the average ordinate is 443.49 / 25 = 17.74 kPa, between the 16.92 kPa found at 5 m and the 19.94 kPa at the base, as it should be for a diagram that grows with depth. With the half-space method PH = 221.74 kN/m, exactly half, at the same depth.
How each input changes the answer
Each row changes one thing in the example and runs the module again, in SI · kN with the rigid-wall method unless a row says otherwise. The numbers are the module’s own.
| Change and why | PH (kN/m) | zR (m) | σH,max (kPa) |
|---|---|---|---|
| The exampleThe reference | 443.49 | 13.68 | 19.94 |
| Half-space method (ψ = 1)Every ordinate halves; the depth does not move | 221.74 | 13.68 | 9.97 |
| q = 40 kPaThe pressure is proportional to q: PH doubles | 886.98 | 13.68 | 39.88 |
| q = 10 kPaPH halves | 221.74 | 13.68 | 9.97 |
| x = 0The load starts at the wall: more force, acting higher | 468.38 | 13.19 | 19.98 |
| x = 5 mThe load is further out: less force, acting lower | 407.49 | 14.28 | 19.78 |
| x = 10 mStill less, and lower | 352.75 | 15.00 | 19.17 |
| c = 0.5 mThe load comes in almost at once at x: more force | 471.43 | 13.16 | 19.99 |
| c = 2 mA steeper ramp than the example | 462.00 | 13.35 | 19.98 |
| c = 10 mThe load reaches q further out: less force, acting lower | 414.10 | 14.11 | 19.76 |
| c = 20 mLess again | 362.68 | 14.67 | 19.02 |
| H = 10 mThe same load on a shorter wall: less area under the diagram | 146.97 | 5.90 | 19.27 |
| H = 15 mLess area under the diagram | 244.78 | 8.54 | 19.74 |
| H = 40 mA taller wall takes more of the diagram; zR moves down | 743.02 | 21.27 | 19.98 |
- q and the method scale everything. Doubling q doubles PH and the peak; the half-space method halves them. Neither moves zR.
- x and c change the shape. Pushing the load away from the wall, or spreading the ramp over a wider band, lowers PH and lowers the point where it acts.
- H sets how much of the diagram is counted. The peak pressure is at the base in these runs, so it rises with H (19.27, 19.74, 19.94 and 19.98 kPa for 10, 15, 25 and 40 m).
Messages
A model that follows the four rules of the table runs without a warning. When a number breaks a rule the module stops: nothing is calculated and it says why, in three places at once.
- A red box under the Method section, live as you type, with the message and what to do.
- The bar turns brown and reads Cannot be analysed, followed by the message.
- Pressing Analyze opens a window titled Cannot be analysed that repeats the message and adds: “Nothing was calculated. Change the inputs marked in red, then press Analyze again.” The drawing reads “Not calculated — correct the highlighted input in the Model tab”, the Results tab reads “Not calculated — see the Model tab.” and the Calculations tab repeats the message.

| When (all are stops) | Message |
|---|---|
| The wall height H is zero, negative or empty | “The wall height H must be greater than zero.” |
| The distance x is negative or empty | “The distance to the ramp start x must be zero or more.” |
| The ramp width c is zero, negative or empty | “The ramp width c must be greater than zero.” |
| The plateau intensity q is negative or empty | “The plateau surcharge q must be zero or more.” |
| Several values are wrong | The messages are listed together, separated by semicolons. |
Each message continues with the same explanation: “The ramp needs a positive width on a wall of positive height, starting at or beyond the wall, and a load of zero or more. Correct the highlighted value in the Model tab.”
Before the first run the Results and Calculations tabs read “Press Analyze on the Model tab to calculate the lateral pressure.” Edit inputs returns to that state.
Good practice and common mistakes
- Measure x from the wall to the foot of the ramp, where the load is zero, and c across the ramp. The distance chain in the drawing shows what the module understood: check it against your plan.
- Choose the method for the wall you have. The rigid wall is the default and gives twice the half-space pressure; do not leave it unchecked.
- Read PH per unit length of wall. The load is long and parallel to the wall, so the force is per metre (or foot) of wall.
- Add the result to the other actions on the wall. The module gives the pressure of the load alone. If the ground carries several loads, run each in its own module with the same method and add the pressures at the same depth in your own analysis.
- Check the units after you switch the system: type values in the units shown beside the boxes.
- Look at the drawing before you analyse. A load that lands in the wrong place is easiest to see in the geometry-only drawing, and you can drag it into place.
- Keep a record. The model is not kept between visits: save the report, which prints the inputs, the working and the results.
Frequently asked questions
How do I calculate the lateral pressure on a wall from a ramp surcharge?
The pressure at a depth is the sum of the elastic stresses of the line loads that make up the ramp and its plateau. In GeoTerva’s Ramp load module you enter the wall height H, the distance x to the foot of the ramp, the ramp width c, the plateau intensity q and the method, press Analyze, and read the resultant PH, its depth zR and the peak pressure. On the module’s example PH = 443.49 kN/m at zR = 13.68 m.
What is a ramp load?
A long load parallel to the wall that is zero at a distance x from it, rises in a straight line to q at x + c and stays at q beyond. The Triangular load module has a load that rises to a peak and falls again, and the Strip load module a uniform load on a strip.
Should I use the rigid-wall or the half-space method?
The rigid-wall method (the default) is for a wall that does not yield: the pressure is twice the half-space stress. The half-space method is for a wall that deflects enough for the soil to follow and gives half of it. On the example they give 443.49 and 221.74 kN/m.
What do x and c measure?
x is the horizontal distance from the wall to the foot of the ramp, where the load is zero; c is the horizontal width over which the load rises to q. The load is at q from x + c outwards, a distance the Ramp end card gives.
Why is the result a force per metre?
The load is long and parallel to the wall, so the pressure is the same along it and the module gives the resultant per unit length of wall: kN/m, tf/m or kip/ft.
Why does the resultant act below mid-height of the wall?
Because the pressure grows with depth. On the example the resultant acts 13.68 m below the ground on a 25 m wall; the mid-height is 12.50 m.
Does the module need soil properties?
No. The pressure comes from the elastic solution for the load and the wall, which does not use unit weights or strength. The soil’s own earth pressure is a separate action, combined with this one in your analysis of the wall.
Can I move the load on the drawing?
Yes, until you press Analyze. Drag the load to move it (x changes) or the knee at x + c to change the ramp width c, in the Elevation, Plan or 3D View. The boxes follow in steps of 0.05 in the unit shown.
What happens with q = 0?
The module runs and gives PH = 0.00 kN/m and a peak pressure of 0.00 kPa. It still reports a resultant depth, here 13.68 m, the depth at which the resultant would act on this geometry.
How can I check a result by hand?
Put x, c, q and a depth z into the equation; the Calculations tab lists R1, R2, α, β and σH at 31 depths to compare with. At 5 m on the example, 2 × 20 / (π × 5) × [5 × 0.62025 − 2 × 0.57004 + 10 ln(8.602 / 5.385)] = 16.92 kPa.
Which units does the module use, and does it keep my model?
SI · kN, SI · tf or US, switchable in the header at any time, also after Analyze; the browser remembers the choice and the cover details of the Report tab. The values are not kept when you close the page: save the report, which prints the inputs and the results.