

What the module calculates
Pile under lateral load works out how far one pile deflects when it is pushed sideways at its head, and the bending moment, shear force and soil reaction along its whole length. The ground can be up to eight layers of sand and clay.
The pile is a beam. The ground is a row of independent springs along it, and each spring follows a p–y curve: the reaction p of the ground per unit length of pile, against the deflection y of the pile at that depth. The curve flattens as the soil yields, so the ground gets softer as the load grows. The module solves the beam equation on these springs, at the load you enter:
E I is the bending stiffness of the pile, P the axial load, which acts through the deflected shape (the P–δ effect), z the depth below the ground surface, and y the deflection, positive in the direction of the load.
What you can describe
- A ground of up to eight layers, each a sand (described by φ′) or a clay (described by cu), with its own thickness and unit weights, and an optional water table.
- A pile that is circular, hollow circular (a pipe), square, or of any other section whose second moment of area I you give: its modulus Ep, a factor on E I for a cracked section, its embedded length L, and a free length e above the ground where the load acts.
- A lateral load H at the head, a moment M at a free head and an axial load P; the head free to rotate or held against rotation; static or cyclic loading.
- The response of the ground by non-linear p–y curves (the API curve for sand and Matlock’s curve for clay) or by an elastic subgrade reaction.
- An optional allowable head deflection and the moment capacity of the section. The module then gives the lateral load at which each is reached.
What you get
- The deflection, rotation, bending moment, shear force and soil reaction at every depth, as diagrams and as a table, with the largest values and the depths they occur at.
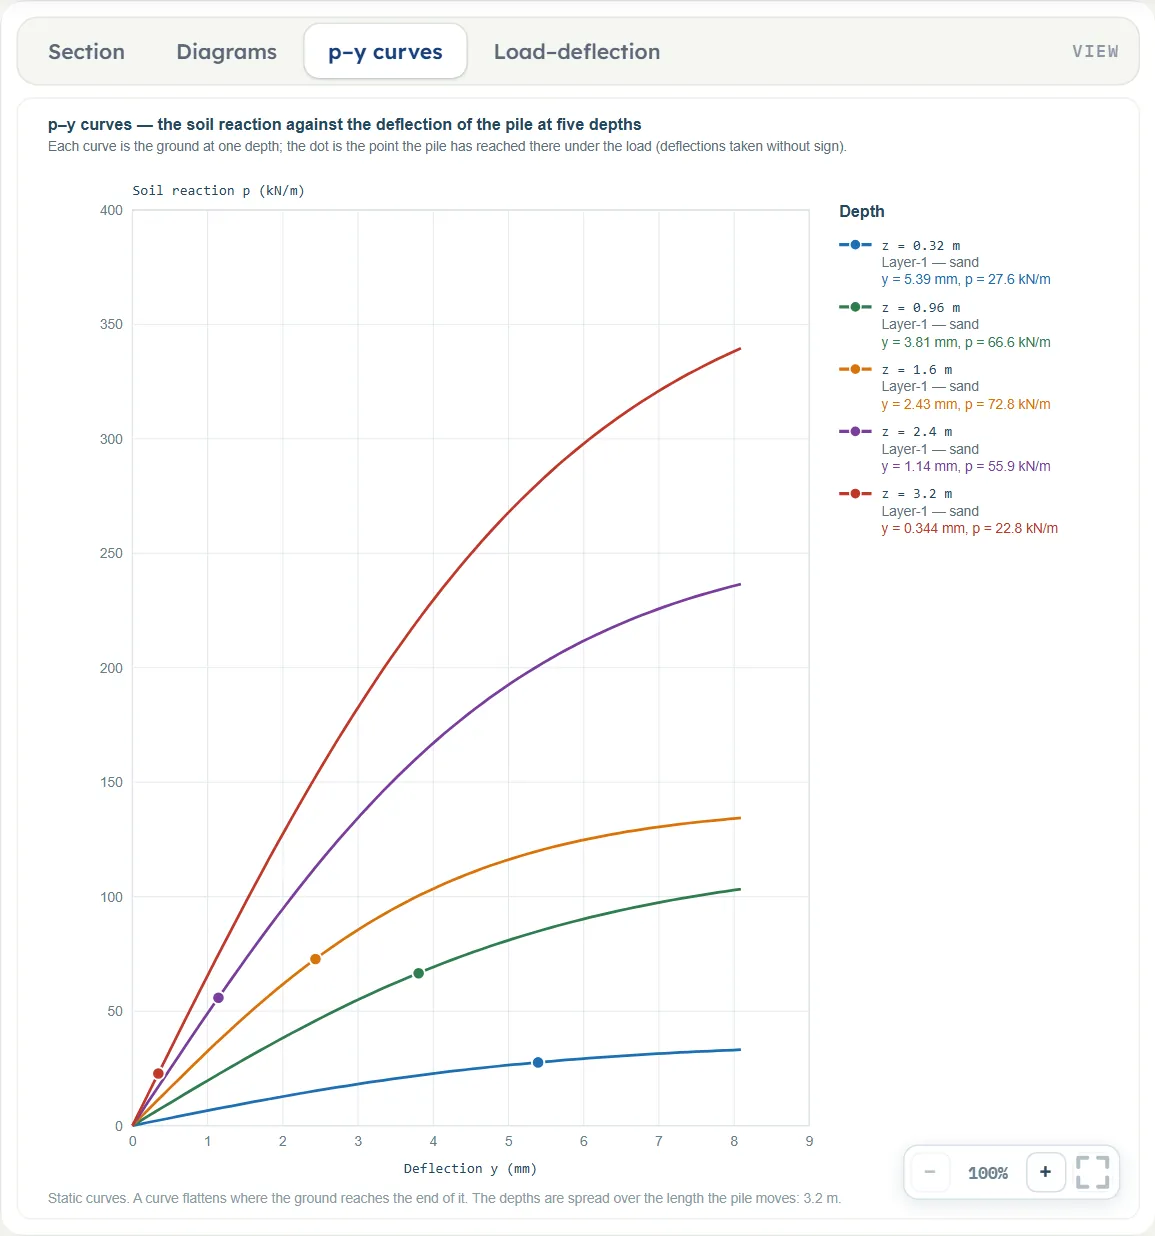
- The p–y curves of the ground at five depths, with the point each depth has reached under the load.
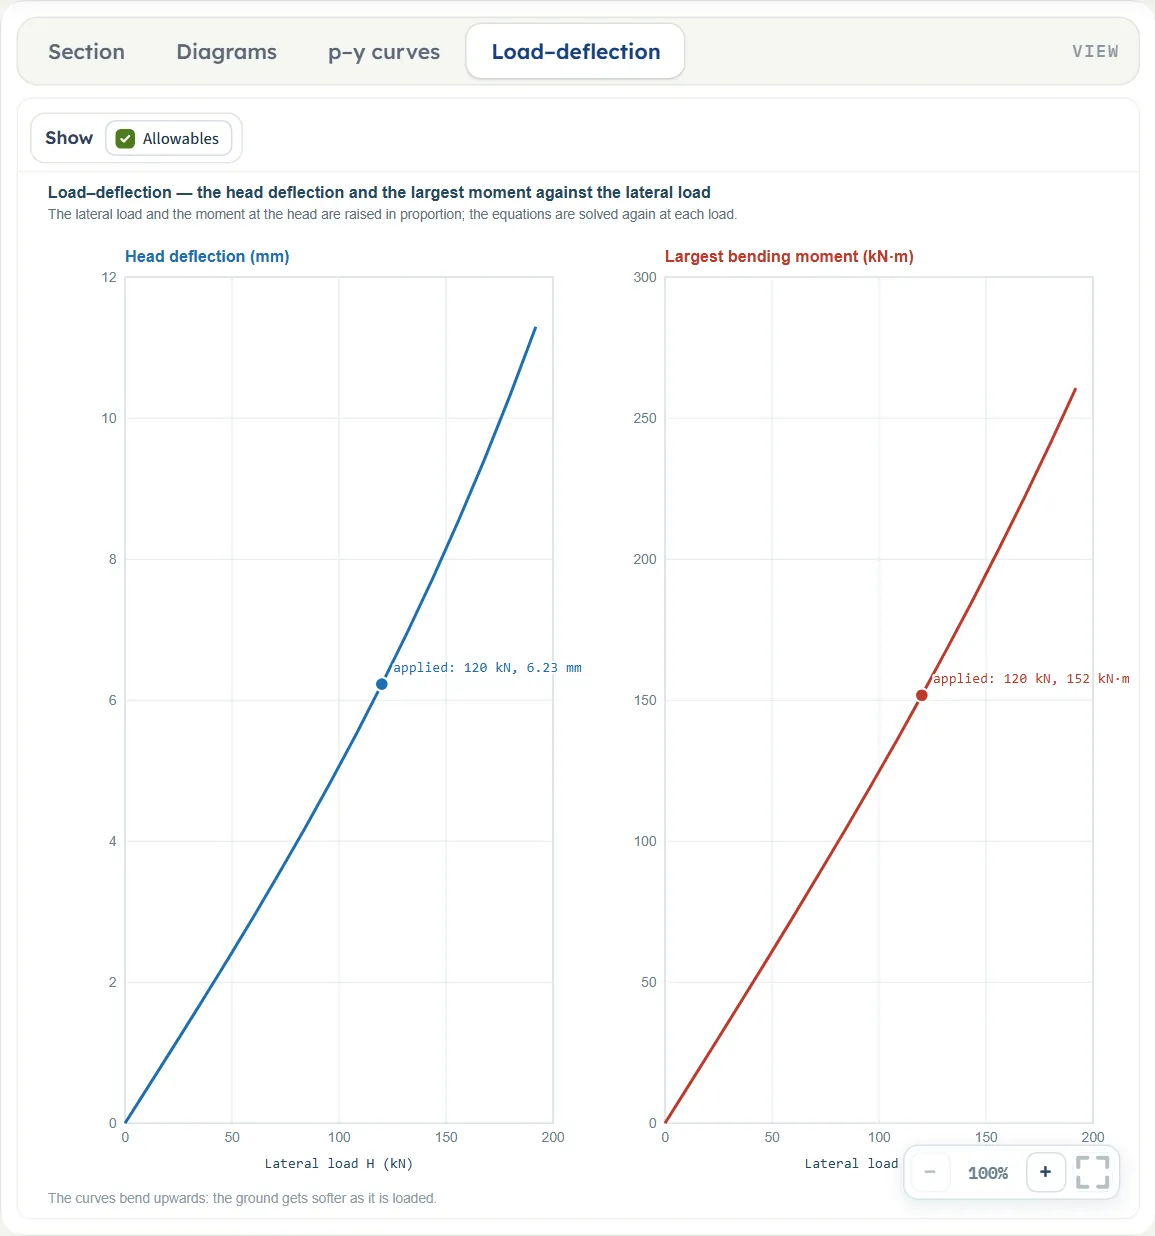
- The load–deflection curve of the head, and the load at an allowable deflection or at the moment capacity.
- The working step by step, and a summary report as PDF or Word.
What belongs to other modules
- This module treats one pile. The load on every pile of a cap, the group effect and the lateral response of its rows belong to Pile group.
- The axial capacity of the pile belongs to Pile in sand, Pile in clay and Pile on layered soil. The axial load P is the compression you enter at the head, taken as the same at every depth; it acts through the deflected shape.
- The pile is a linear-elastic beam of one section. The strength of that section belongs to the structural design of the pile: you give its moment capacity Mcap and the module compares the largest moment with it, and you represent a cracked concrete section by the factor on E I.
- The loads and the limits are yours; the module gives the response to exactly those, and the loads at which your allowable deflection and your moment capacity are reached.
Before you start: what you need
Have these ready from your ground investigation and your design:
| What | Where it comes from | Notes |
|---|---|---|
| The ground profile: the thickness of each layer and whether it is a sand or a clay | Boring logs | Up to eight layers from the ground surface down. The layers must reach at least the pile tip. A laterally loaded pile moves mainly in the upper part of its length (in the example, the top 8 m or so), so describe that part of the profile with the most care. |
| Unit weights γ and γsat | Laboratory tests or correlations | γ applies above the water table, γsat below it. They give the effective stress, which sets the ultimate resistance of the ground. |
| Friction angle φ′ of each sand layer | SPT or CPT correlations, tests | An effective friction angle, from 15° to 50°. It gives the ultimate resistance and, through the API chart, the initial modulus k of the p–y curve. |
| Undrained shear strength cu of each clay layer | Tests or correlations | At least 1 kPa. It gives the ultimate resistance; the strain ε50 and Matlock’s J are filled in from it, and you can type in measured values. |
| Water table depth | Piezometers, borings | Optional. Below it the submerged unit weight is used, and the initial modulus of a sand layer is taken for submerged sand. |
| The pile: section, width or diameter D, modulus Ep, embedded length L | Your design | D is the width the soil reaction acts over. For a section that is not circular, hollow circular or square you also need the second moment of area I from the table of the section. |
| Cracking of a concrete pile | Structural design | A factor on E I. Often 0.5 to 0.8 for a section that cracks; 1 leaves E I as it is. |
| The loading at the head | Your design | The lateral load H, the moment M (free head), the axial load P, the height e of the load above the ground, whether a cap holds the head against rotation, and whether the load is sustained or repeated. |
| Allowable head deflection and moment capacity | Your design criteria | Optional: the limits you want the module to compare the analysis with. |
Quick start in nine steps
- Open the module and choose the units
Open Pile under lateral load from the Piles family. Pick SI · kN, SI · tf or US in the header; you can change it at any time. Open Pile under lateral load.
- Describe the soil layers
In Soil layers, fill in the New layer form: an optional name, Sand or Clay, the thickness, γ and γsat, and φ′ for a sand or cu for a clay. Press + Add layer and repeat from the ground surface down. The layers must reach the pile tip.
- Set the groundwater
In Groundwater, choose Present and give the depth Dw of the water table, or choose None.
- Describe the pile
In Pile, choose the section (Circular, solid, Circular, hollow (pipe), Square or Other (I given)), then enter the width or diameter D, the modulus Ep, the factor on E I, the embedded length L and the free length e.
- Describe the loading
In Loading, choose Free to rotate or Held against rotation and Static (sustained) or Cyclic (repeated), then enter the lateral load H, the moment M (free head only) and the axial load P.
- Choose the response of the ground
In Soil response, choose Non-linear p–y curves or Elastic subgrade reaction. For the p–y curves each layer shows constants that fill themselves in: k for a sand, ε50 and J for a clay. Type over them only when you have better values.
- Add the limits you design to (optional)
In Design, enter the allowable deflection yall of the head and the moment capacity Mcap of the section. The module then checks the analysis against them and gives the lateral load at which each is reached.
- Press Analyze
Press Analyze. The Results tab gives the head deflection, the largest moment and where it is; the drawing now carries the deflected shape of the pile.
- Read the diagrams and take the report
Open the Diagrams, p–y curves and Load–deflection views; the Calculations tab shows every step; the Report tab saves a PDF or a Word file.
The screen: four views of the pile
The layout is the one every GeoTerva module shares, described in the workspace guide. For this module the drawing has four views, chosen with the buttons above it. Section follows your inputs; the other three show results, and ask you to press Analyze until there are results.
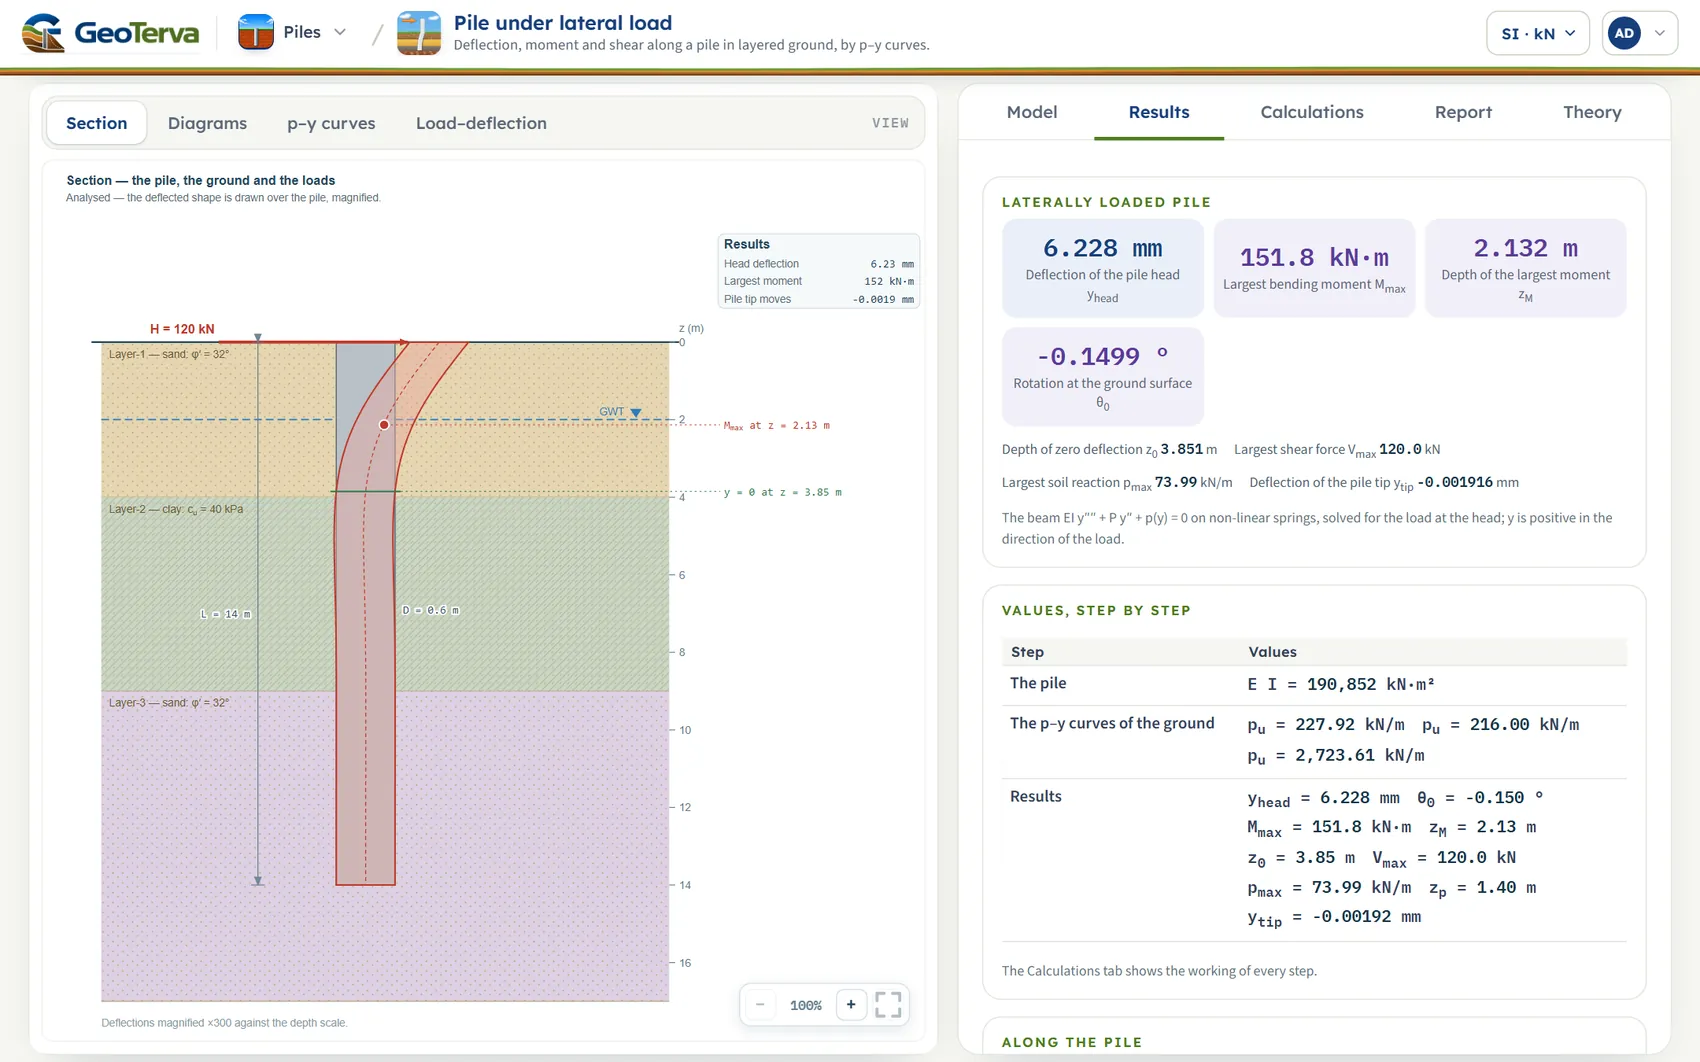
- The four views. Section, Diagrams, p–y curves and Load–deflection.
- The pile. In its layers, with the deflected shape drawn over it, magnified; the foot of the drawing states the factor.
- The results on the drawing. Head deflection, largest moment and the movement of the tip.
- The cards. Head deflection, largest moment, its depth, and the rotation at the ground surface.
- The steps. The values step by step; below them the table along the pile, depth by depth.
Section
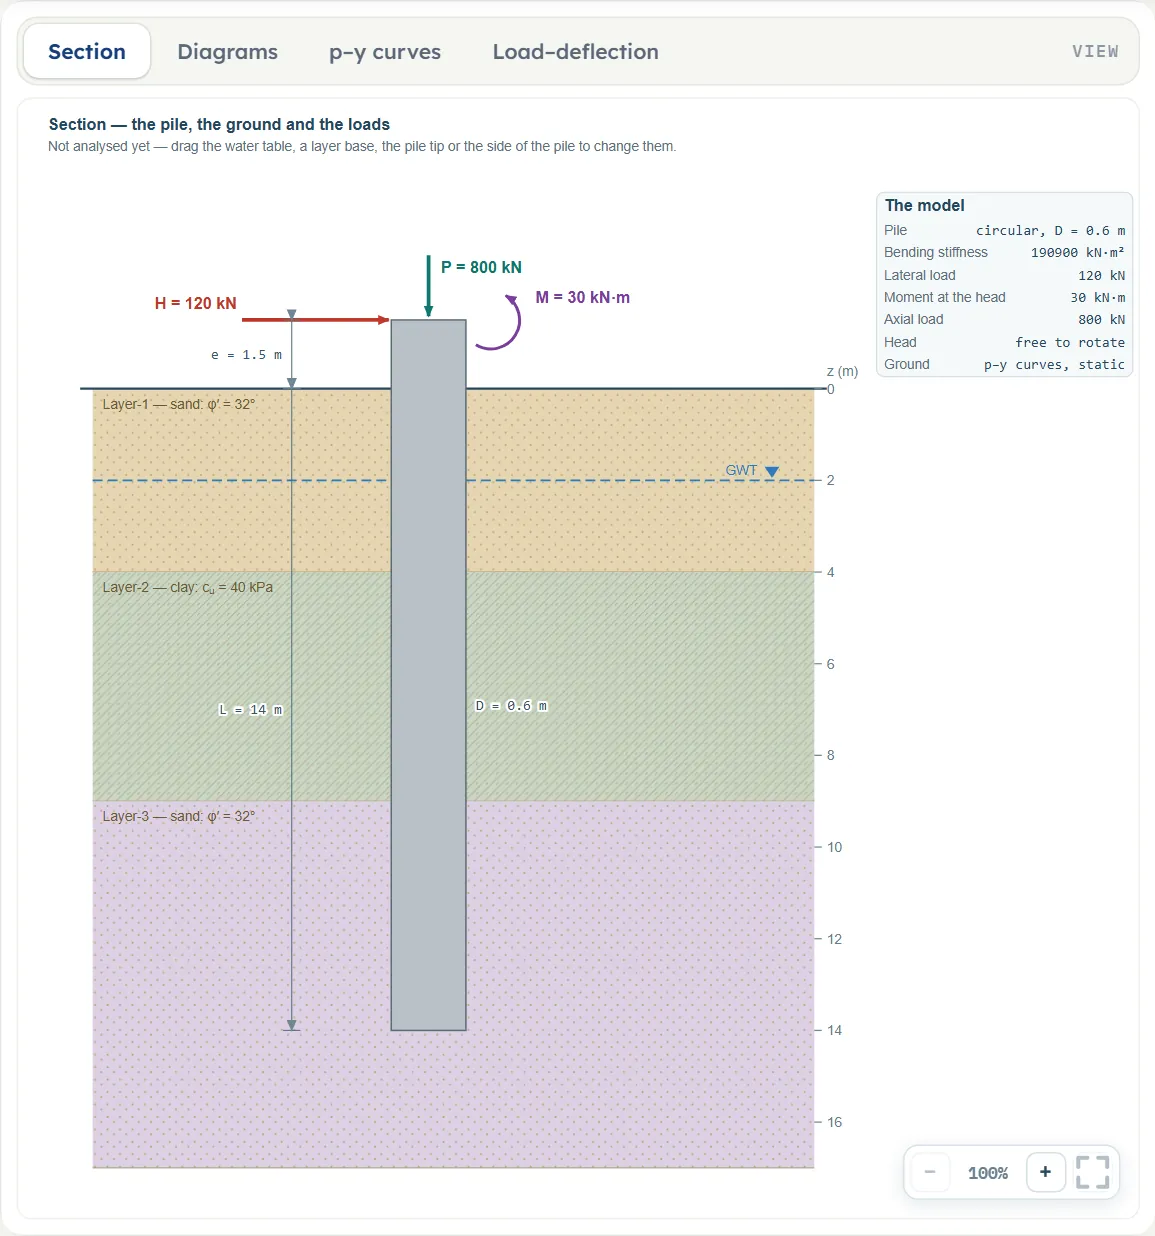
The pile in its layers, with the lateral load H, the free length e, the water table, and the dimensions L and D. A moment and an axial load at the head are drawn too when you enter them. Before Analyze you can drag a layer base (it moves with the layer below it; the base of the last layer has no handle), the water table (Dw), the pile tip (L) or the side of the pile (it changes D by twice the pull, in steps of 1 cm); the input boxes follow, and the handles disappear after Analyze.
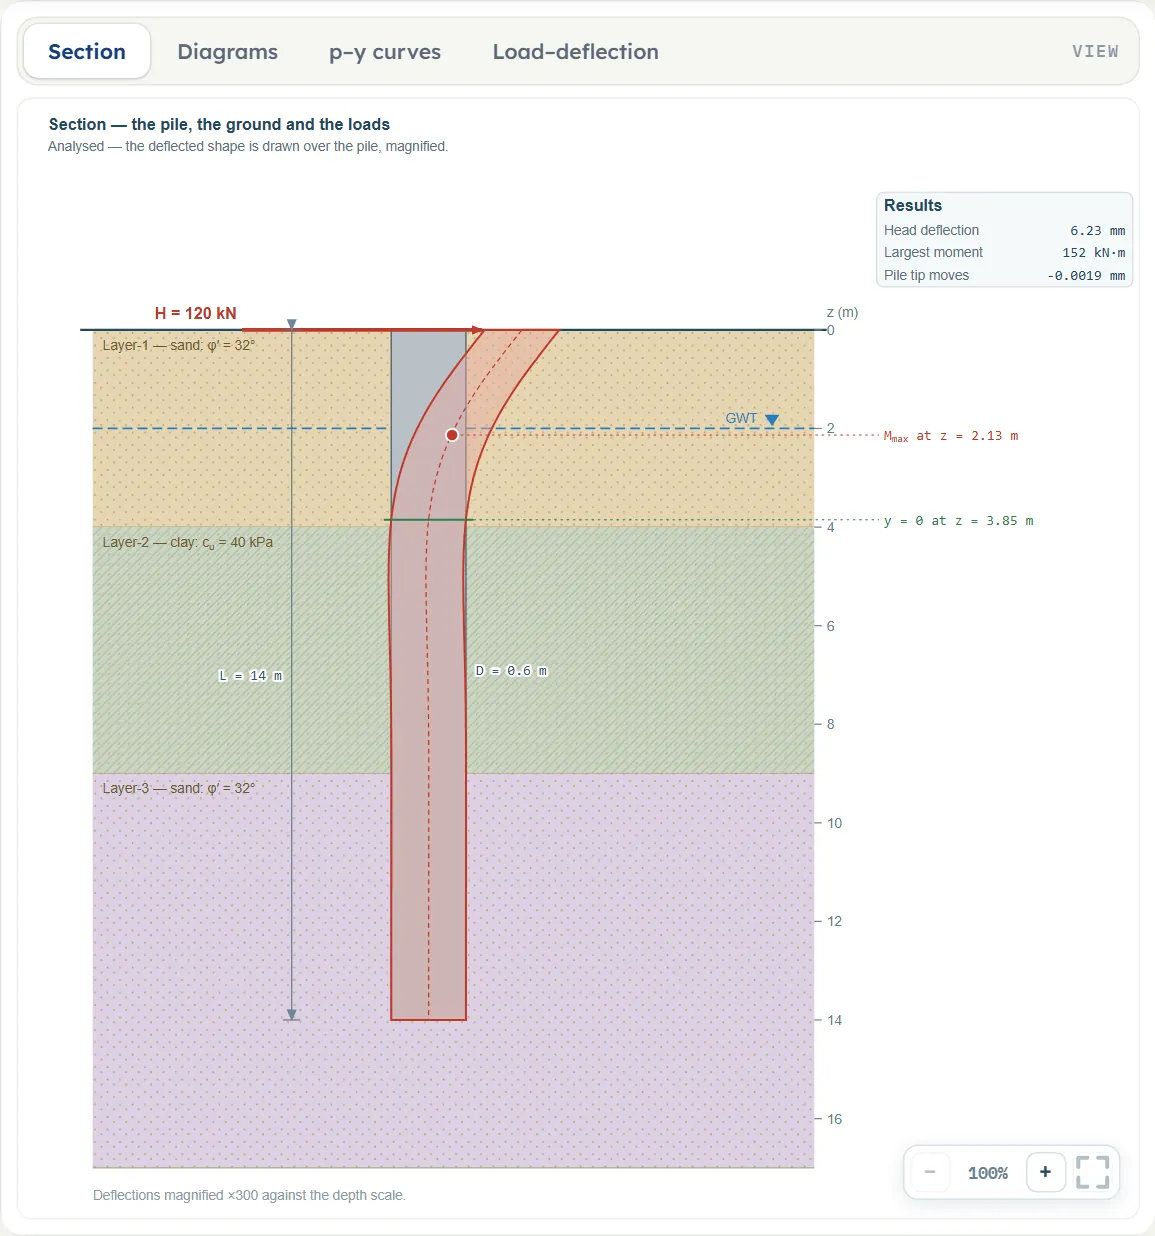
After Analyze the deflected shape is drawn over the pile, magnified so that it can be seen (the foot of the drawing says by how much). The largest moment is marked at its depth, the depth of zero deflection is drawn as a line, and a small panel gives the head deflection, the largest moment and the movement of the tip.
Here is the same view before Analyze, with a free length, a moment and an axial load entered. The arrows at the head are the lateral load H (at the top of the free length), the moment M and the axial load P.
Diagrams
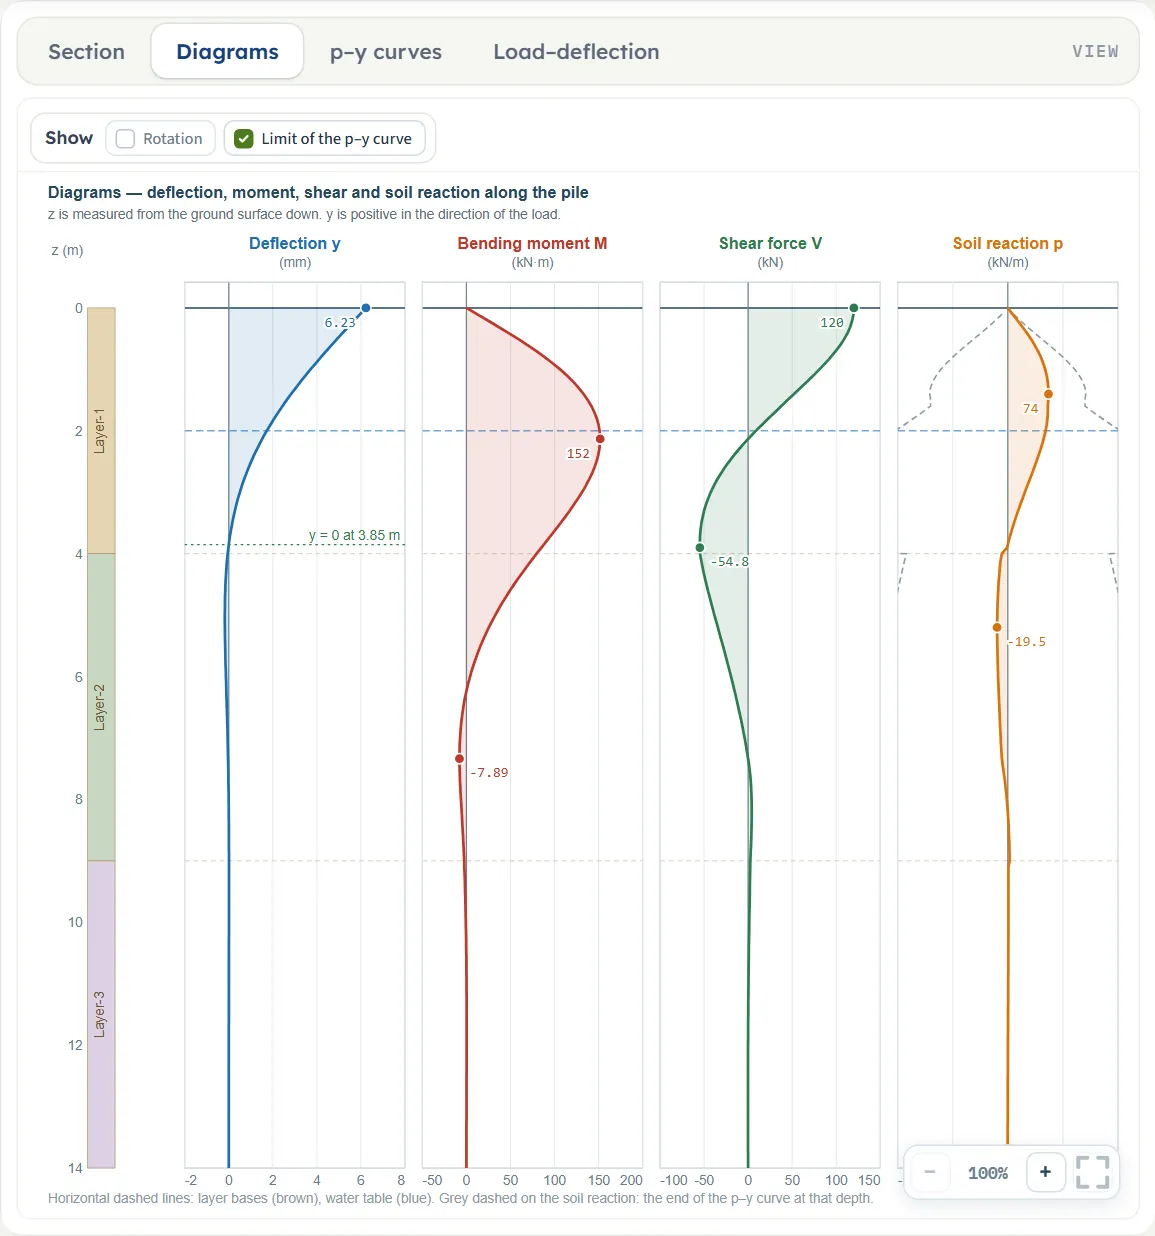
The deflection y, the bending moment M, the shear force V and the soil reaction p along the pile, side by side on a common depth scale, with the coloured strip of the layers beside the depth axis. The largest value of each is marked. Horizontal dashed lines show the layer bases (brown) and the water table (blue).
Two switches above the drawing: Rotation adds the rotation θ (off at first); Limit of the p–y curve (on) draws, in grey on the soil-reaction diagram, the end of the p–y curve at each depth, so you can see where the ground is near its limit.
p–y curves
The p–y curve of the ground at five depths, spread over the length the pile moves: the soil reaction p per unit length against the deflection y. A dot on each curve marks the point the pile has reached at that depth under the load; the legend gives the depth, the layer, and the deflection and reaction there.
A dot on the straight beginning of a curve is soil still working elastically; a dot near the flat end is soil at its limit. Only the sand curve has a straight beginning; the clay curve rises as the cube root of the deflection. The foot of the drawing says whether the curves are static or cyclic (with the elastic response it says the curves are straight lines, and the choice of static or cyclic has no effect).
Load–deflection
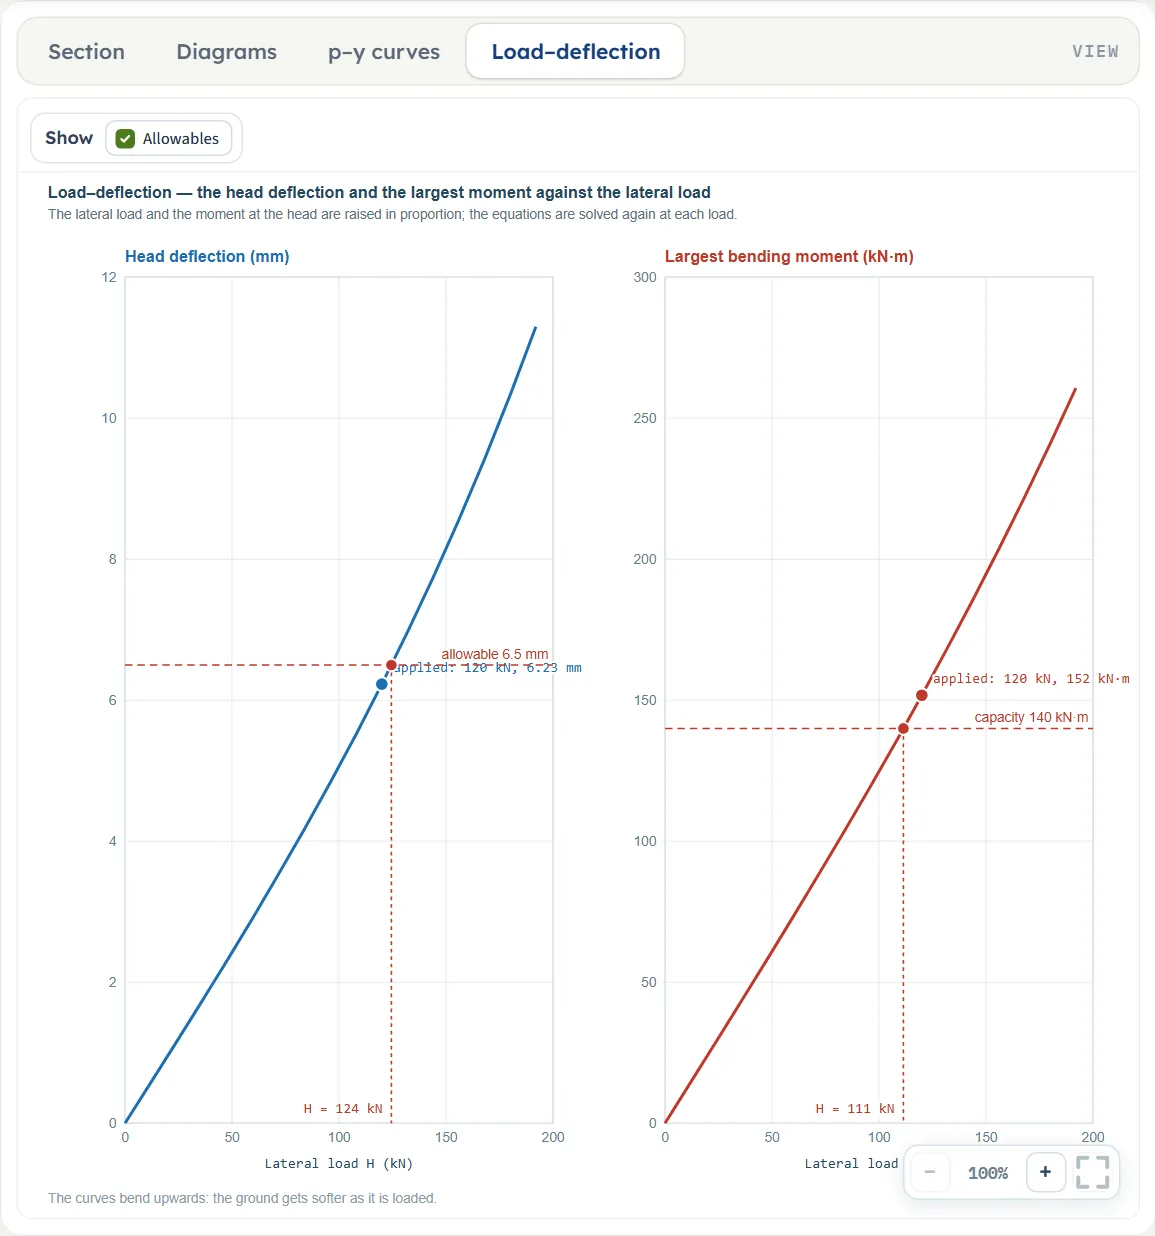
Two curves against the lateral load H: the head deflection and the largest bending moment. The lateral load and the moment at the head are raised in proportion and the equations are solved again at each load; the applied load is marked on both curves. With Allowables on, a limit you entered in Design is drawn with the load at which the curve reaches it.
The curves bend upwards: the ground gets softer as it is loaded, so doubling the load more than doubles the deflection (on the example, 2.54 times).
Entering the model, section by section
The Model tab has six sections after Model data. Each opens when you click its title; Next and Back at the foot walk you through them. A (?) beside a title or a choice opens a help window with a drawing and the formula for that part. The tables below list every field with its symbol, the unit in each unit system, and its default (defaults are shown in SI · kN). Where a unit is shown twice or three times, such as m · ft, the units are those of SI · kN, SI · tf and US in turn, and equal ones are merged. A field marked “filled in” carries a value the module works out; you can type over it, and empty the box to get the module’s value back.
Soil layers
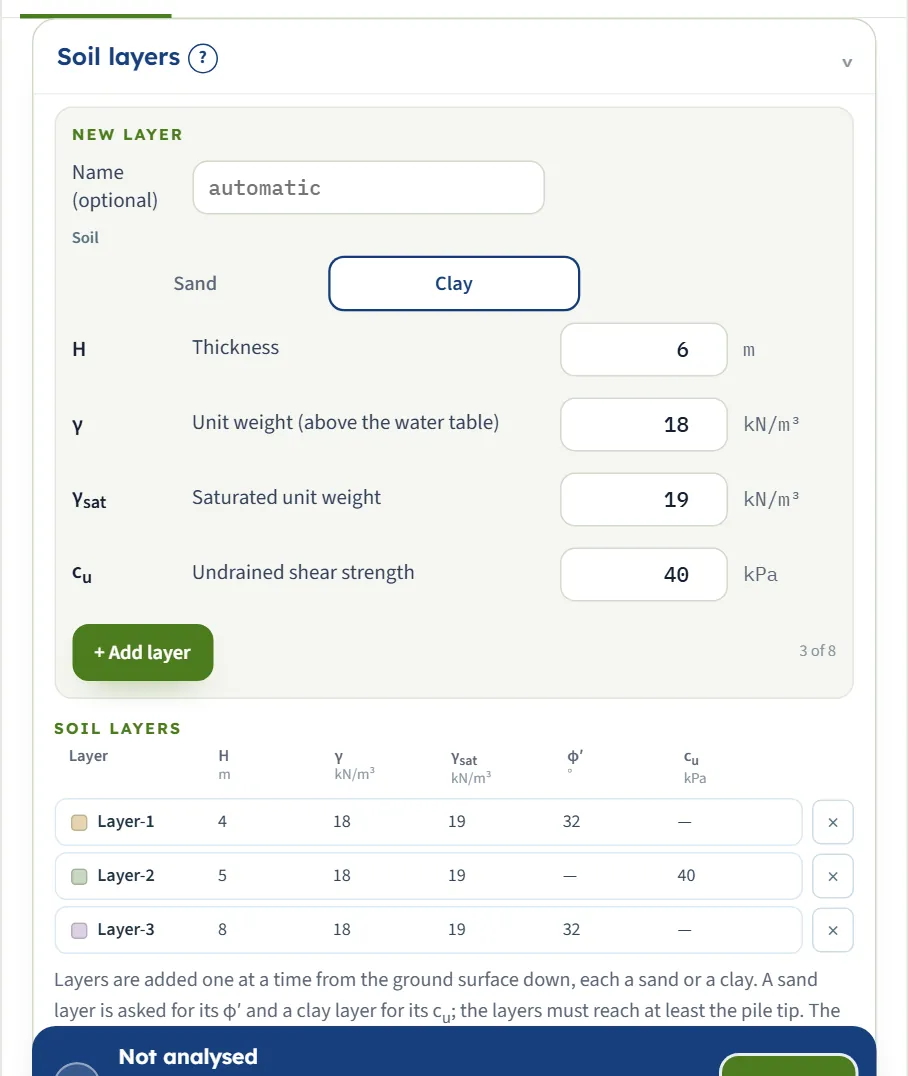
Up to eight layers, entered from the ground surface down, each a sand or a clay. The Soil choice of the New layer form decides which strength is asked for: φ′ for a sand, cu for a clay. The ground is the same at every depth along a layer; the resistance at a depth is worked out from the effective stress there, so the unit weights and the water table matter. The values in the table are those of layer 1.
| Choice | Options | Default |
|---|---|---|
| Soil of the layer | Sand Clay | Alternating, starting with a sand: layers 1, 3 … sand, layers 2, 4 … clay |
| Field | Symbol | Unit | Default | What to enter |
|---|---|---|---|---|
| Name (optional) | — | — | empty | A name for the layer, for the drawing and the report. Left empty, the layers are called Layer-1, Layer-2 and so on. |
| Thickness | H | m · ft | 4 | Thickness of the layer, at least 0.1 m. The layers together must reach at least the pile tip. The example has 4 m, 5 m and 8 m. |
| Unit weight (above the water table) | γ | kN/m³ · t/m³ · pcf | 18 | Unit weight of the soil above the water table. With the water table it gives the effective vertical stress σ′ at each depth, which sets the ultimate resistance. |
| Saturated unit weight | γsat | kN/m³ · t/m³ · pcf | 19 | Unit weight below the water table; there the module uses γsat − γw for the effective stress. Shown when water table is Present. |
| Friction angle | φ′ | ° | 32 | Effective friction angle of a sand layer, from 15° to 50°. It gives the ultimate resistance of the sand and, through the API chart, the filled-in initial modulus k. Shown when the layer is Sand. |
| Undrained shear strength | cu | kPa · kg/cm² · psf | 40 | Undrained shear strength of a clay layer, at least 1 kPa. It gives the ultimate resistance of the clay and the filled-in ε50 and J. Shown when the layer is Clay. |
Groundwater
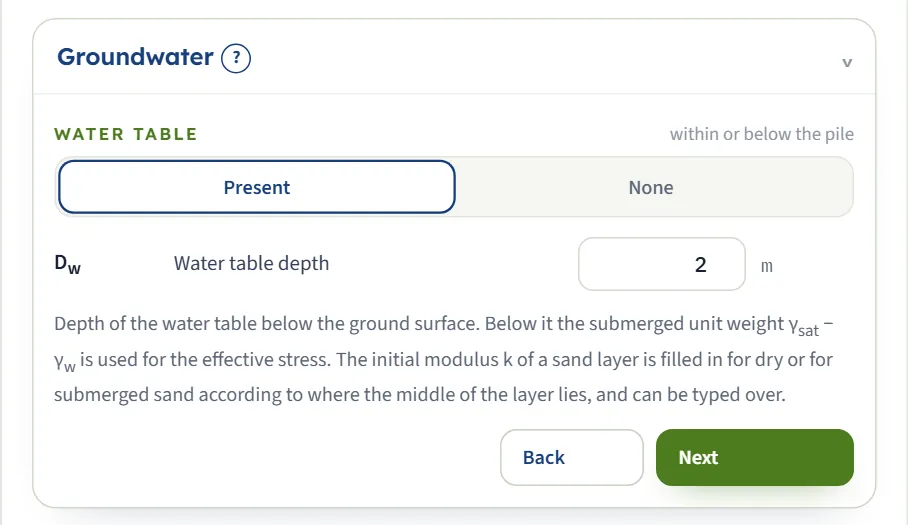
Choose whether there is a water table and, if there is, its depth. Below it the effective stress is worked out with the submerged unit weight γsat − γw, with γw = 9.81 kN/m³.
| Choice | Options | Default |
|---|---|---|
| Water table within or below the pile | Present None | Present |
| Field | Symbol | Unit | Default | What to enter |
|---|---|---|---|---|
| Water table depth | Dw | m · ft | 2 | Depth of the water table below the ground surface, 0 or more. Below it the submerged unit weight γsat − γw is used. It also decides whether the filled-in k of a sand layer is that of dry or of submerged sand (by where the middle of the layer lies). Shown when water table is Present. |
Pile
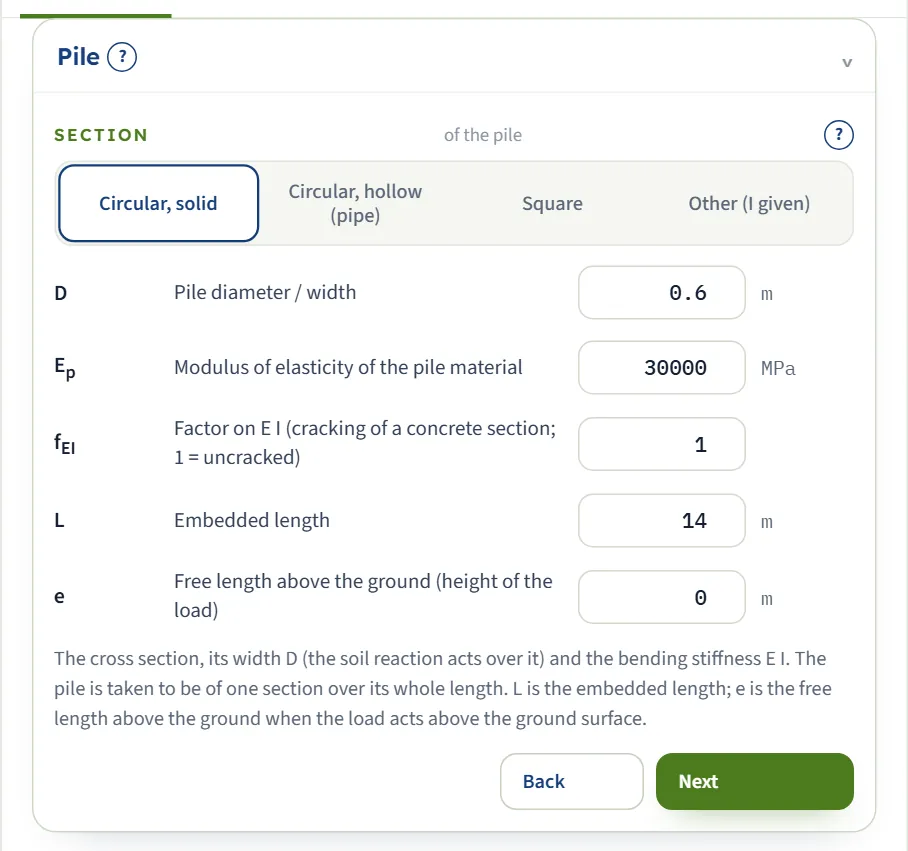
The section gives the second moment of area I: πD⁴/64 for the solid circle, π(D⁴ − (D − 2t)⁴)/64 for the pipe, D⁴/12 for the square, or the value you enter for Other (I given). With the modulus Ep and the factor fEI it gives the bending stiffness E I = Ep I fEI. The pile is taken to be of one section over its whole length.
| Choice | Options | Default |
|---|---|---|
| Section of the pile | Circular, solid Circular, hollow (pipe) Square Other (I given) | Circular, solid |
| Field | Symbol | Unit | Default | What to enter |
|---|---|---|---|---|
| Pile diameter / width | D | m · ft | 0.6 | Width of the pile, at least 0.05 m: the diameter of a circular pile. The soil reaction acts over it, so it enters the p–y curves for every section; for the circular, pipe and square sections it also gives I. |
| Wall thickness of the pipe | t | m · ft | 0.02 | Wall thickness of the pipe. It must be more than 0 and less than D/2; I = π (D⁴ − (D − 2t)⁴) / 64. Shown when section is Circular, hollow (pipe). |
| Second moment of area about the axis of bending | I | cm⁴ · in⁴ | 636170 | Second moment of area about the axis the load bends the pile about, from the table of the section. D above is still the width the soil reaction acts over. The value shown is that of the 0.6 m circular pile. Shown when section is Other (I given). |
| Modulus of elasticity of the pile material | Ep | MPa · kg/cm² · ksi | 30000 | Modulus of elasticity of the pile material: about 30 000 MPa for a concrete pile, 200 000 MPa for steel. The bending stiffness is E I = Ep I fEI. |
| Factor on E I (cracking of a concrete section; 1 = uncracked) | fEI | — | 1 | A reinforced concrete pile that cracks under the moment is less stiff than its gross section: often 0.5 to 0.8 for a section that cracks. 1 leaves E I as it is. The field accepts 0.05 to 1.5. Run fEI = 1 as well: the cracked section gives the larger deflection, the gross section the larger moment. |
| Embedded length | L | m · ft | 14 | Embedded length from the ground surface to the tip, at least 0.5 m. The pile is of one section over its whole length. |
| Free length above the ground (height of the load) | e | m · ft | 0 | The pile stands this far above the ground surface where the load is applied; 0 is a load at the ground surface. The pile above the ground has no soil on it. |
Loading
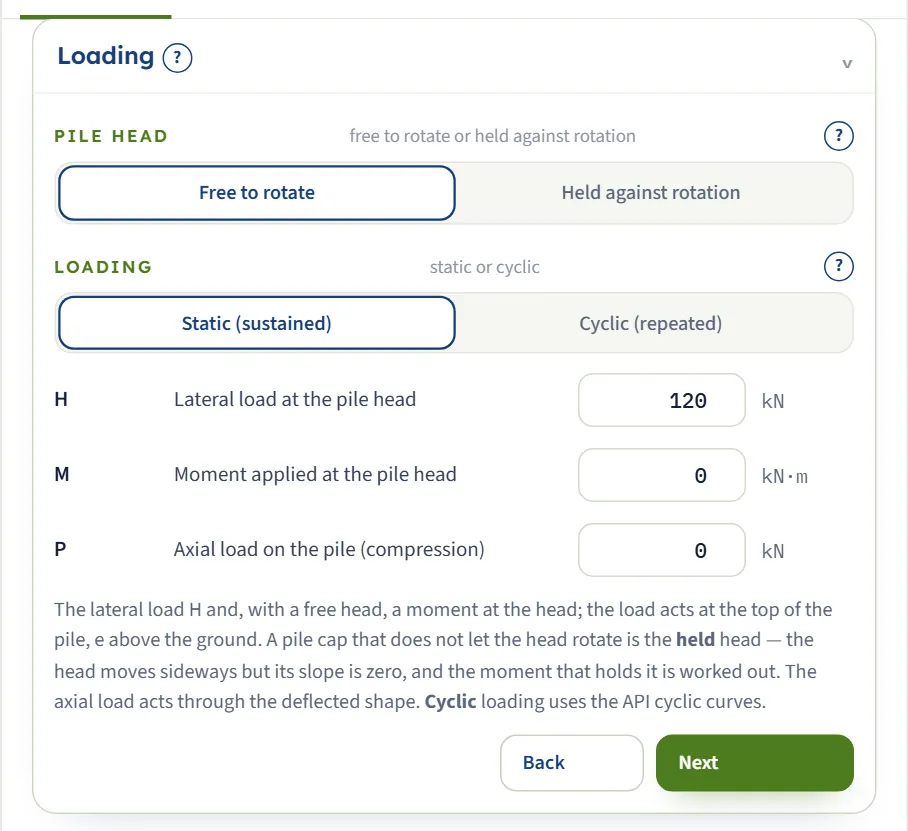
The head is free to rotate or held against rotation, and the loading is static or cyclic. The load acts at the top of the pile, e above the ground. A cap that does not let the head rotate is the held head: the head moves sideways but its slope is zero, and the moment that holds it is worked out. The axial load acts through the deflected shape.
| Choice | Options | Default |
|---|---|---|
| Pile head free to rotate or held against rotation | Free to rotate Held against rotation | Free to rotate |
| Loading static or cyclic | Static (sustained) Cyclic (repeated) | Static (sustained) |
| Field | Symbol | Unit | Default | What to enter |
|---|---|---|---|---|
| Lateral load at the pile head | H | kN · tf · kip | 120 | The lateral load at the head: the load the analysis is run for. |
| Moment applied at the pile head | M | kN·m · tf·m · kip·ft | 0 | A moment at the head of a pile free to rotate. It is positive in the sense that adds to the deflection the lateral load causes. With a held head there is no moment to enter: the moment that holds the head is worked out. Shown when pile head is Free to rotate. |
| Axial load on the pile (compression) | P | kN · tf · kip | 0 | Axial compression on the pile, taken as constant over the whole length. It acts through the deflected shape (P–δ), so it adds to the deflection and the moments. |
Soil response
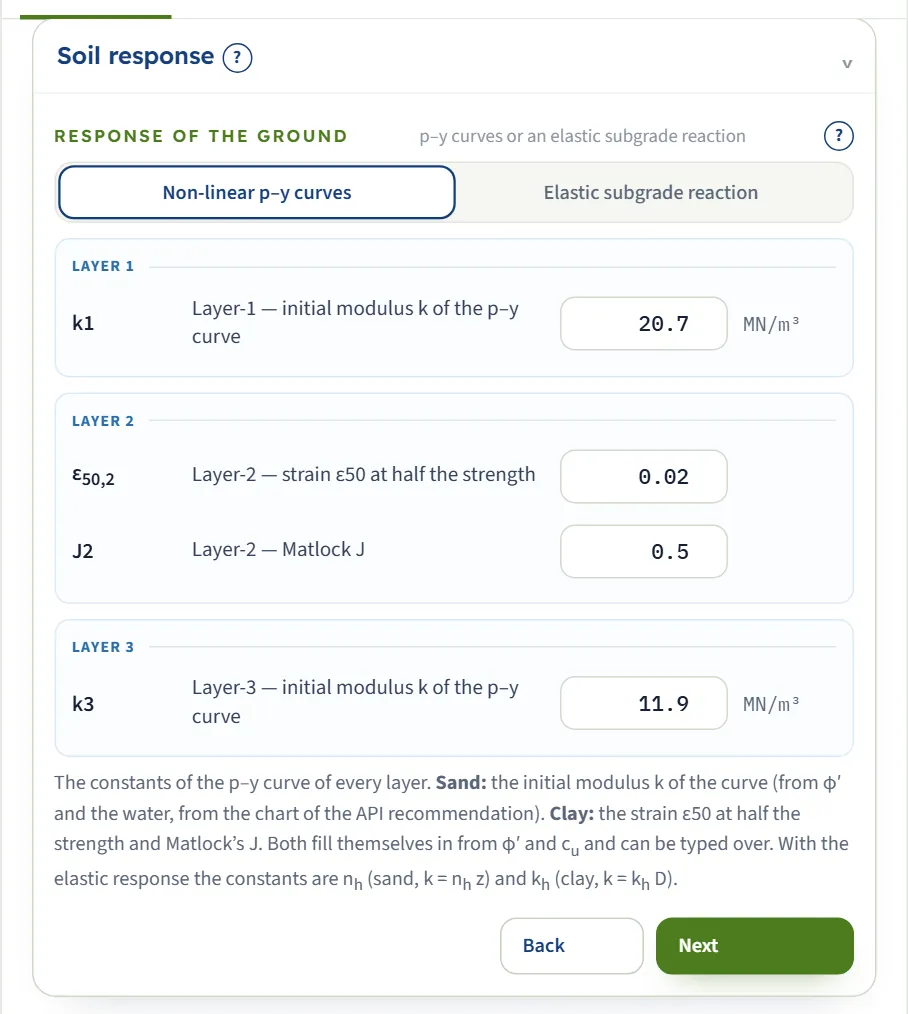
The constants of the curve of every layer, shown for the soil type of that layer. With Non-linear p–y curves a sand layer shows k, a clay layer ε50 and J; with Elastic subgrade reaction a sand layer shows nh and a clay layer kh. The p–y constants fill themselves in from φ′, cu and the water; the values shown below are layer 1 of the example, a sand.
| Choice | Options | Default |
|---|---|---|
| Response of the ground p–y curves or an elastic subgrade reaction | Non-linear p–y curves Elastic subgrade reaction | Non-linear p–y curves |
| Field | Symbol | Unit | Default | What to enter |
|---|---|---|---|---|
| Initial modulus k of the p–y curve | k | MN/m³ · t/m³ · pci | filled in | The slope of the sand p–y curve at the origin is k z. It is filled in from φ′ and the water, from the chart of the API recommendation, rounded to 0.1 MN/m³ and never below 5.4 MN/m³ (so φ′ of 28° or less gives 5.4 MN/m³ dry or submerged); a layer whose middle lies exactly at Dw takes the dry value. Type over it to use your own value. Shown when the layer is Sand and response of the ground is Non-linear p–y curves. |
| Strain ε50 at half the strength | ε50 | — | filled in | The strain at half the maximum deviator stress in the undrained test; y50 = 2.5 ε50 D. Filled in from cu (0.020 soft, 0.010 medium, 0.005 stiff); type in a measured value if you have one. Shown when the layer is Clay and response of the ground is Non-linear p–y curves. |
| Matlock J | J | — | filled in | The empirical constant of Matlock’s near-surface wedge: 0.5 for a soft clay, 0.25 for a medium to stiff one. Filled in from cu. Shown when the layer is Clay and response of the ground is Non-linear p–y curves. |
| Constant nh of the subgrade reaction | nh | MN/m³ · t/m³ · pci | 8 | Elastic response only. In a sand layer the subgrade reaction is k = nh z, growing with depth. Shown when the layer is Sand and response of the ground is Elastic subgrade reaction. |
| Coefficient kh of horizontal subgrade reaction | kh | MN/m³ · t/m³ · pci | 15 | Elastic response only. In a clay layer the subgrade reaction is k = kh D, constant over the layer. Shown when the layer is Clay and response of the ground is Elastic subgrade reaction. |
Design
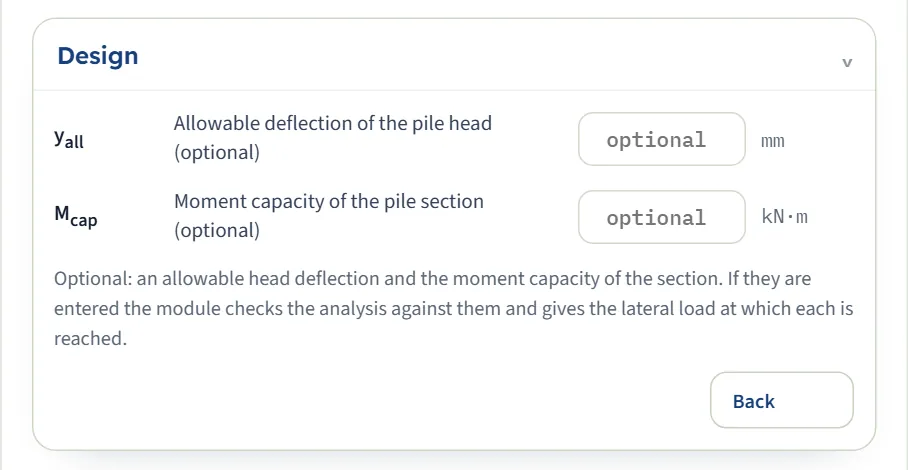
Both limits are optional and independent. If you enter one, the module compares the analysis with it, writes the verdict on the Results tab, and gives the lateral load at which the pile reaches it.
| Field | Symbol | Unit | Default | What to enter |
|---|---|---|---|---|
| Allowable deflection of the pile head (optional) | yall | mm · in | empty | Optional. If it is entered the module checks the head deflection against it and gives the lateral load at which it is reached. |
| Moment capacity of the pile section (optional) | Mcap | kN·m · tf·m · kip·ft | empty | Optional: the design moment the section can carry, from the structural design of the pile. The module checks the largest moment against it and gives the lateral load at which it is reached. |
Choosing the response and the loading
Three choices decide how the pile and the ground answer: the response of the ground, static or cyclic loading, and the pile head. They are independent, so every combination can be run and compared.
The response of the ground
| Ground | Curve | Ultimate resistance | Constants |
|---|---|---|---|
| Sand, non-linear | p = A pu tanh(k z y / (A pu)), with A = max(0.9, 3 − 0.8 z/D) for a static load and 0.9 for a cyclic one | pu = the smaller of (C1 z + C2 D) σ′ and C3 D σ′, with C1, C2, C3 from φ′ | φ′; k (filled in from φ′ and the water) |
| Clay, non-linear | p = 0.5 pu (y/y50)1/3 up to y = 8 y50, then pu; y50 = 2.5 ε50 D | pu = the smaller of (3 + σ′/cu + J z/D) cu D and 9 cu D | cu; ε50 and J (filled in from cu) |
| Elastic, either soil | p = k y, a straight line with no limit | None | nh in a sand (k = nh z); kh in a clay (k = kh D) |
The sand curve is the one of API RP 2A, built by Reese, Cox and Koop (1974) from tests on a pile in sand; the clay curve is Matlock’s (1970) soft-clay curve as API RP 2A states it. The non-linear curves are the default. The elastic option replaces each curve by its straight line: it is a beam on an elastic foundation, good where deflections are small and where you work with a coefficient of subgrade reaction of your own.
Static or cyclic loading, free or held head
| Choice | What it does | On the example |
|---|---|---|
| Static (sustained) | The static p–y curves. | The reference: yhead = 6.228 mm, Mmax = 151.8 kN·m. |
| Cyclic (repeated) | The API cyclic curves. In a sand the factor A is 0.9 at every depth. In a clay the curve stops at 0.72 pu from 3 y50 at depth; nearer the surface it then falls to a lower value. The same load gives a larger deflection and moment. | yhead = 7.280 mm (+17 %), Mmax = 172.0 kN·m (+13 %). |
| Free to rotate | Nothing holds the head from turning: the moment at the head is zero, or the moment you apply. The pile deflects most at the head and its largest moment is a little below the surface. | The reference. |
| Held against rotation | A cap keeps the slope of the head at zero. The head still moves sideways, but less, and a moment develops at the head to hold it. On the example it is larger than the largest moment of the free pile, but under a larger load or with a free length it can be smaller, so compare the two runs. The module gives it as Moment holding the head. | yhead = 2.241 mm (−64 %), holding moment -174.8 kN·m. |
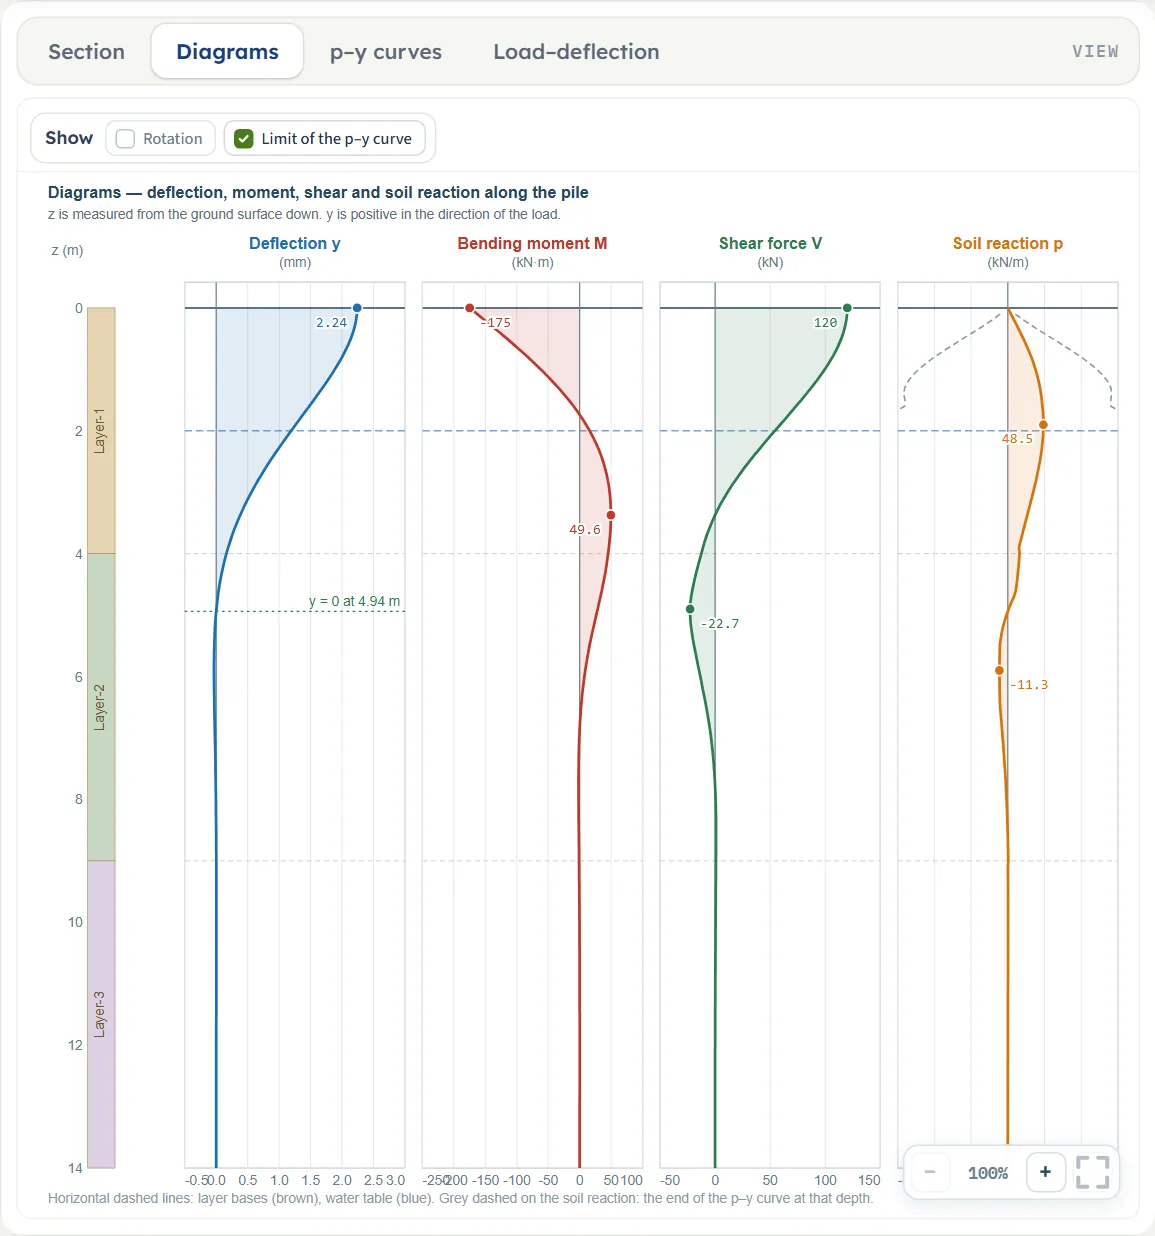
The Diagrams view of the same pile held against rotation. The deflection at the head is 2.241 mm instead of 6.228 mm. The moment is largest at the head, -174.8 kN·m (negative, opposite in sign to the moment of the free pile), and falls to zero and then to a positive peak of 49.6 kN·m about 3.4 m down; the shear still starts at H.
Which should I pick?
- Start with the non-linear p–y curves. They are the default, and the only response that limits the soil reaction by the strength of the ground. The elastic response gives yhead = 10.49 mm on the example, with the module’s own nh and kh; its constants are yours to justify, so it is another ground, not a check of the p–y curves.
- Use cyclic loading for loads that repeat many times: wind, waves, traffic, braking. A sustained load, such as earth pressure on the pile, is static.
- Choose the head from the connection. (With the elastic response, static and cyclic give identical results.) A rigid pile cap or a stiff superstructure holds the head; take it free to rotate where the connection cannot carry a moment. How near a real cap comes to a held head depends on the stiffness of the cap and the superstructure, and the real condition lies between the two. Free gives the largest deflection and in-ground moment; held gives the largest head moment and the smallest deflection, so each quantity is bounded by the two runs.
- Keep the section honest. A concrete pile that cracks is more flexible than its gross section: enter a factor on E I (often 0.5 to 0.8 for a section that cracks). Run fEI = 1 as well: the cracked section gives the larger deflection, the gross section the larger moment.
Analyze and read the results
Press Analyze. The bar turns green (brown when the run raised a warning), the inputs lock, and the Results tab shows three blocks.
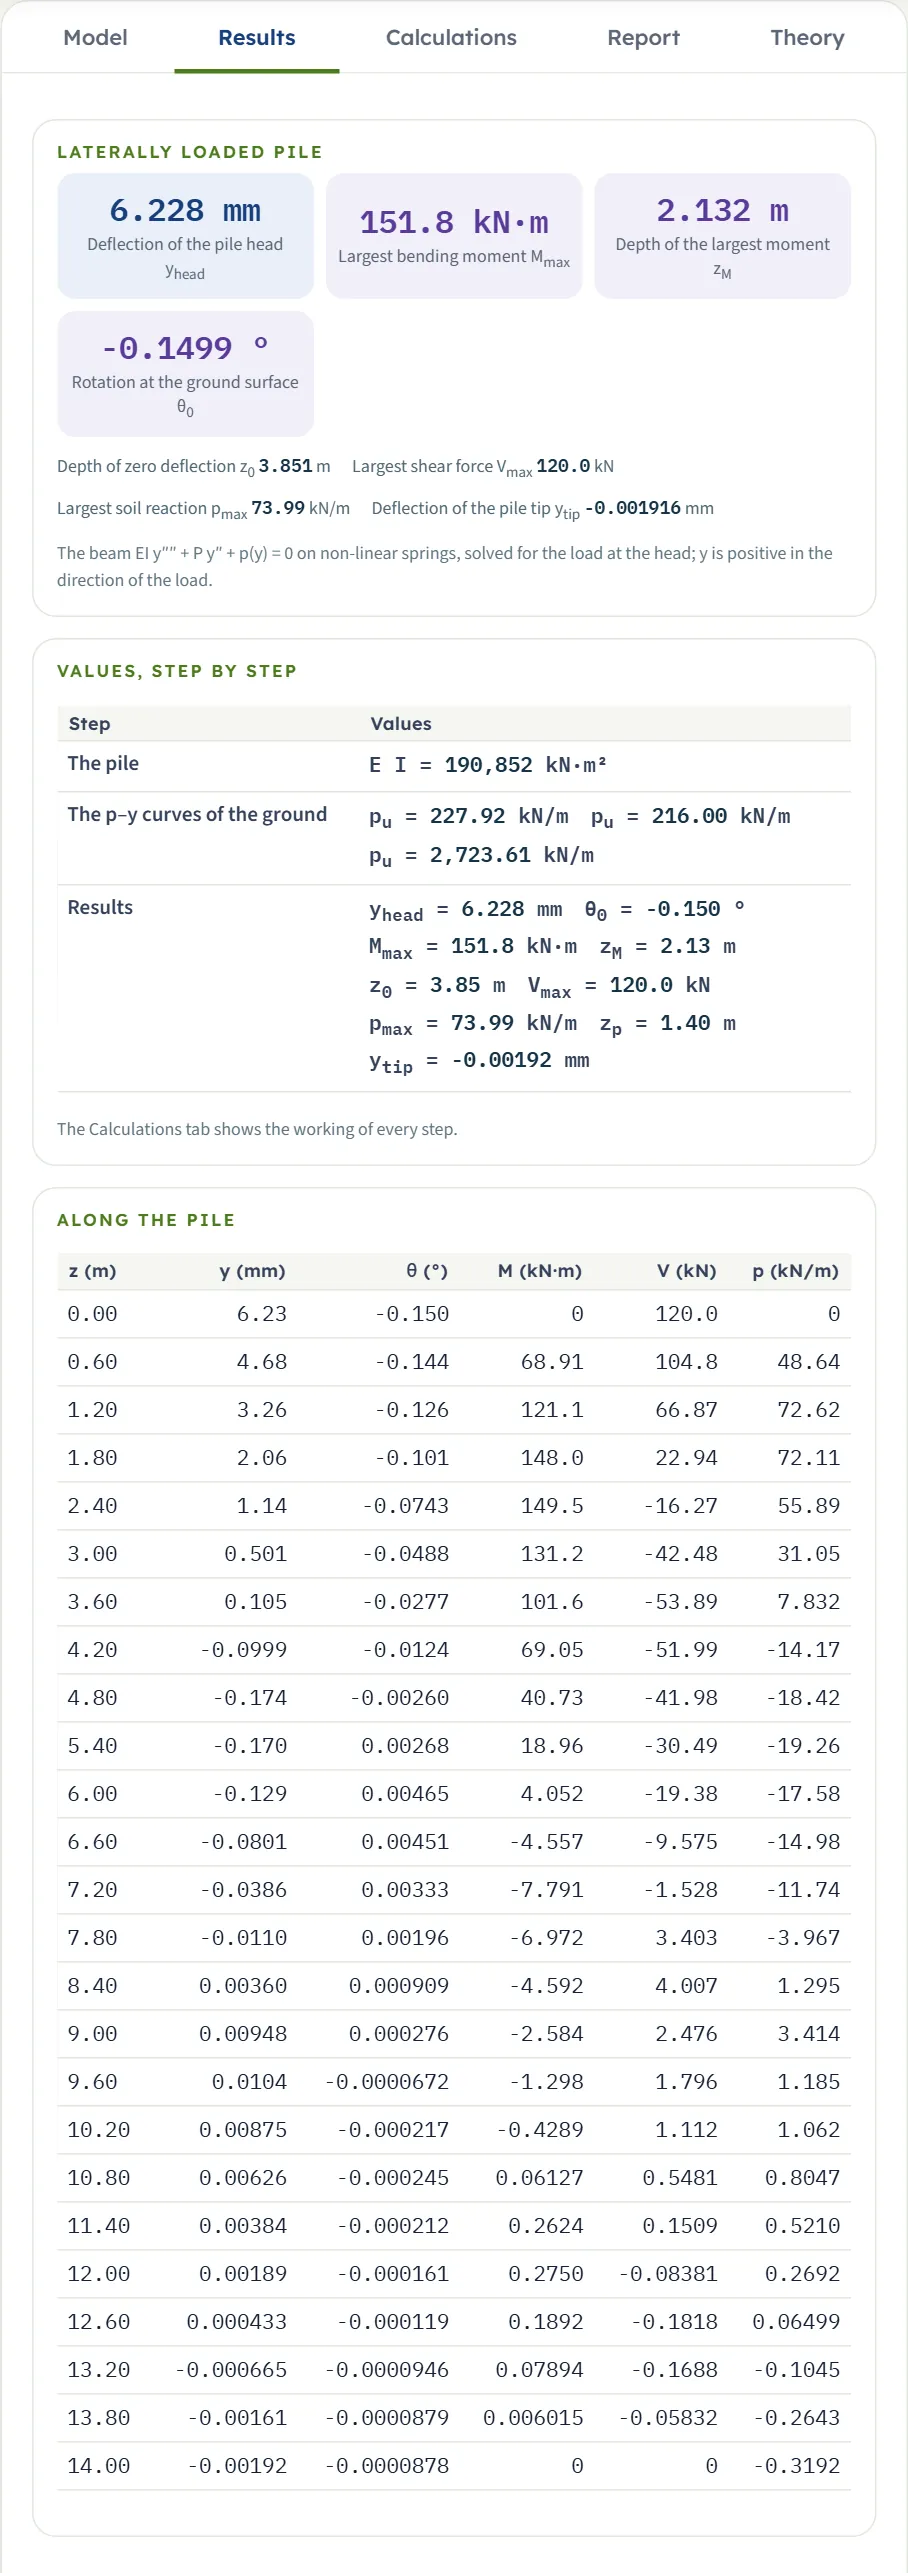
- Laterally loaded pile. Cards for the deflection of the pile head yhead, the largest bending moment Mmax, the depth zM of the largest moment and the rotation θ0 at the ground surface. Below them, in lines: the depth z0 of zero deflection, the largest shear force Vmax, the largest soil reaction pmax and the deflection of the pile tip ytip.
- Values, step by step. One row per step: the bending stiffness E I, the ultimate resistance pu at the middle of each layer, and all the results.
- Along the pile. A table of z, y, θ, M, V and p at about 25 depths, from the head to the tip.
With a free length, the deflection y0 at the ground surface is added as a card and the rotation moves to the lines. With a held head, the Moment holding the head is a card. With an allowable value entered, the lateral load at which it is reached is a card (for a moment only, H = 0 with a moment at a free head, the cards read Moment at the allowable deflection and Moment at the moment capacity), and the verdict is written on the card it belongs to.
The signs
- The depth z is measured down from the ground surface; a negative depth is above the ground.
- The deflection y is positive in the direction of the load, so the head deflection of a pile pushed forward is positive.
- The rotation θ is the slope dy/dz, so it is negative for a pile that leans over in the direction of the load: -0.1499° in the example.
- The shear V at the head is H, and M at a free head is the moment you apply (zero if you apply none). The soil reaction p has the sign of the deflection: it is the force per unit length that the ground gives back, against the movement.
Reading the example
For the module’s own example (the full numbers are in the worked example), the Diagrams view and the table tell this story from the top down:
- The deflection is largest at the head, 6.228 mm. It passes through zero at 3.851 m: above that depth the pile pushes into the ground, below it the pile moves back by a few tenths of a millimetre at most, and the deflection is practically zero below about 8 m.
- The moment is zero at the free head, grows to Mmax = 151.8 kN·m at 2.132 m, where the shear passes through zero, and dies away below. The small reverse moment lower down is in the table.
- The shear starts at H = 120 kN, changes sign at the depth of the largest moment, and is zero at the free tip.
- The tip hardly moves (ytip = -0.001916 mm, a few micrometres): the pile is long for this load in this ground. When the tip does move, the pile is short and its length governs (see Messages).
- The soil reaction peaks at 73.99 kN/m at 1.40 m. The grey limit on the Diagrams view shows the ground is well below its limit there: the reaction is about half of the end of the curve at that depth.
Checking the allowable values
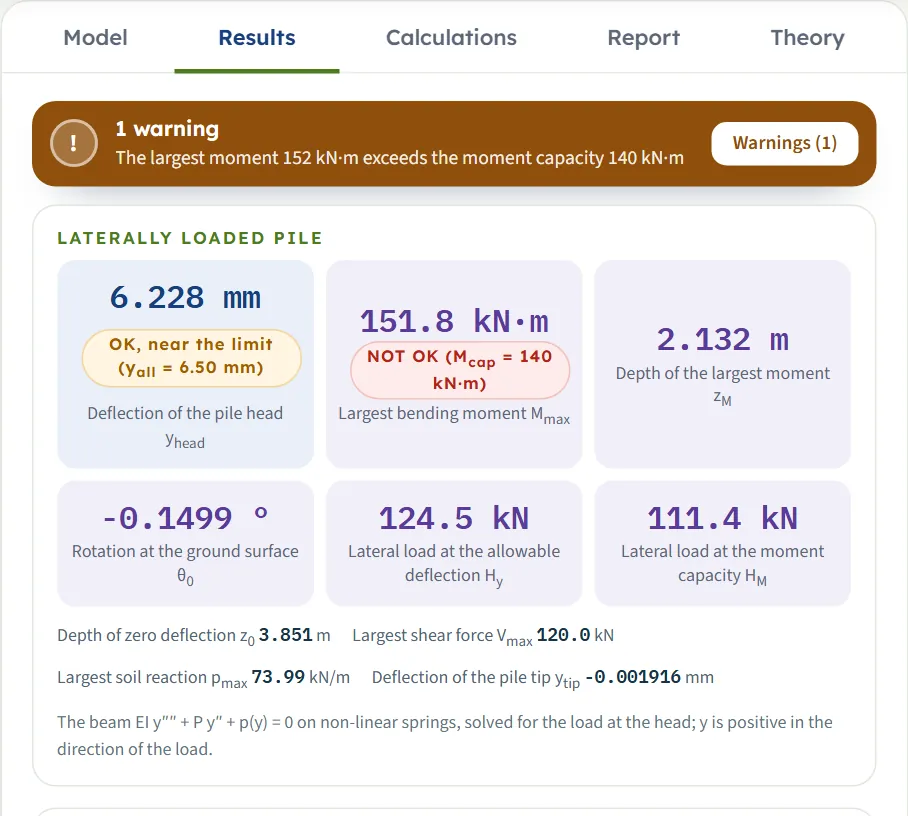
If you entered an allowable head deflection yall or a moment capacity Mcap, the card it belongs to carries a verdict in words: OK, OK, near the limit (the value is within the limit but above 90 % of it) or NOT OK, followed by the limit you entered. (The panel on the Section view and the summary of the report word the same check as “not exceeded” or “EXCEEDED”.) A failing check also raises a warning with advice. The card Lateral load at the allowable deflection or Lateral load at the moment capacity gives the load at which the pile reaches the limit.
| Limit entered | Verdict | Lateral load at the limit (kN) | What it means |
|---|---|---|---|
| yall = 10 mm | OK (yall = 10.0 mm) | 175.7 | The head deflection of 6.228 mm is within the limit; the limit is reached at 1.46 times the load of 120 kN. |
| yall = 5 mm | NOT OK (yall = 5.00 mm) | 98.90 | The deflection exceeds the limit. The load that gives 5 mm is 82 % of the load entered. |
| Mcap = 250 kN·m | OK (Mcap = 250 kN·m) | 185.5 | The largest moment of 151.8 kN·m is within the capacity; it is reached at 1.55 times the load. |
| Mcap = 140 kN·m | NOT OK (Mcap = 140 kN·m) | 111.4 | The largest moment exceeds the capacity; the capacity is reached at 93 % of the load. |
Because the ground is non-linear, the load at a limit cannot be read off the working load by proportion. The module raises the load and the moment at the head in proportion (a factor on H and M, with the axial load kept) and solves the equations again at each load until the limit is reached. If the ground cannot carry a load that large, the card reads not reached and the Load–deflection view writes “not reached before equilibrium is lost” beside the limit.
The Calculations tab and the report
The Calculations tab writes out the working in chapters: Given and what is sought, then one chapter per step, then the notes and assumptions. For this module the steps are:
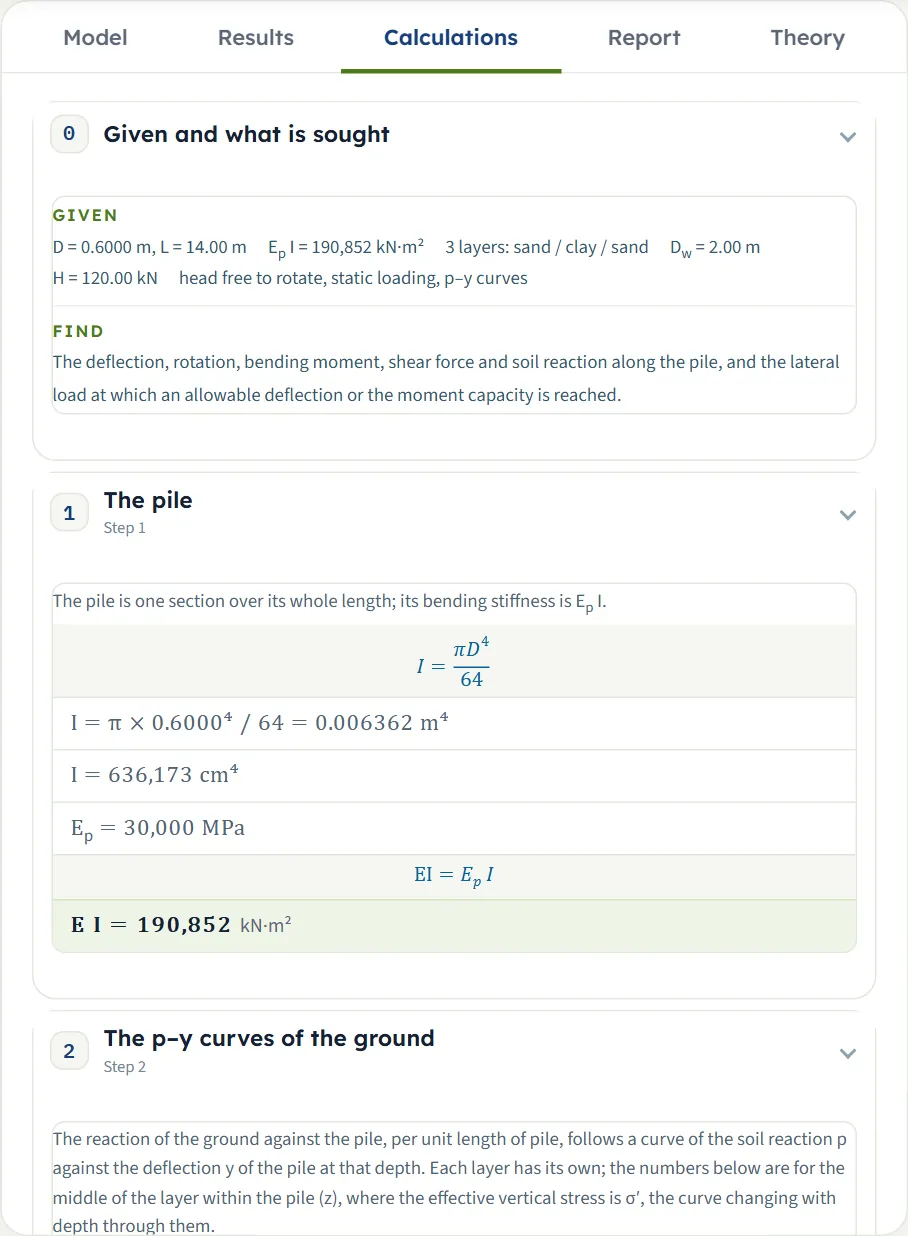
- The pile — I from the section and E I = Ep I (times the factor for cracking, when it is not 1).
- The p–y curves of the ground (or The elastic subgrade reaction of the ground) — for each layer, at the middle of the layer within the pile: the effective stress σ′, the coefficients, pu, and the factor A and k of a sand or y50 of a clay.
- Analysis of the beam on the springs — the beam equation, the number of beam elements, the iterations to equilibrium, and two checks: the sum of the soil reaction against H, and the moment at the tip by statics.
- Results — yhead, θ0, Mmax, zM, z0, Vmax, pmax, zp and ytip, and the table along the pile; the held head adds Mhead and a free length adds y0.
- The load at the allowable deflection and at the moment capacity — only when you entered a limit: the load factor at which it is reached and the load.
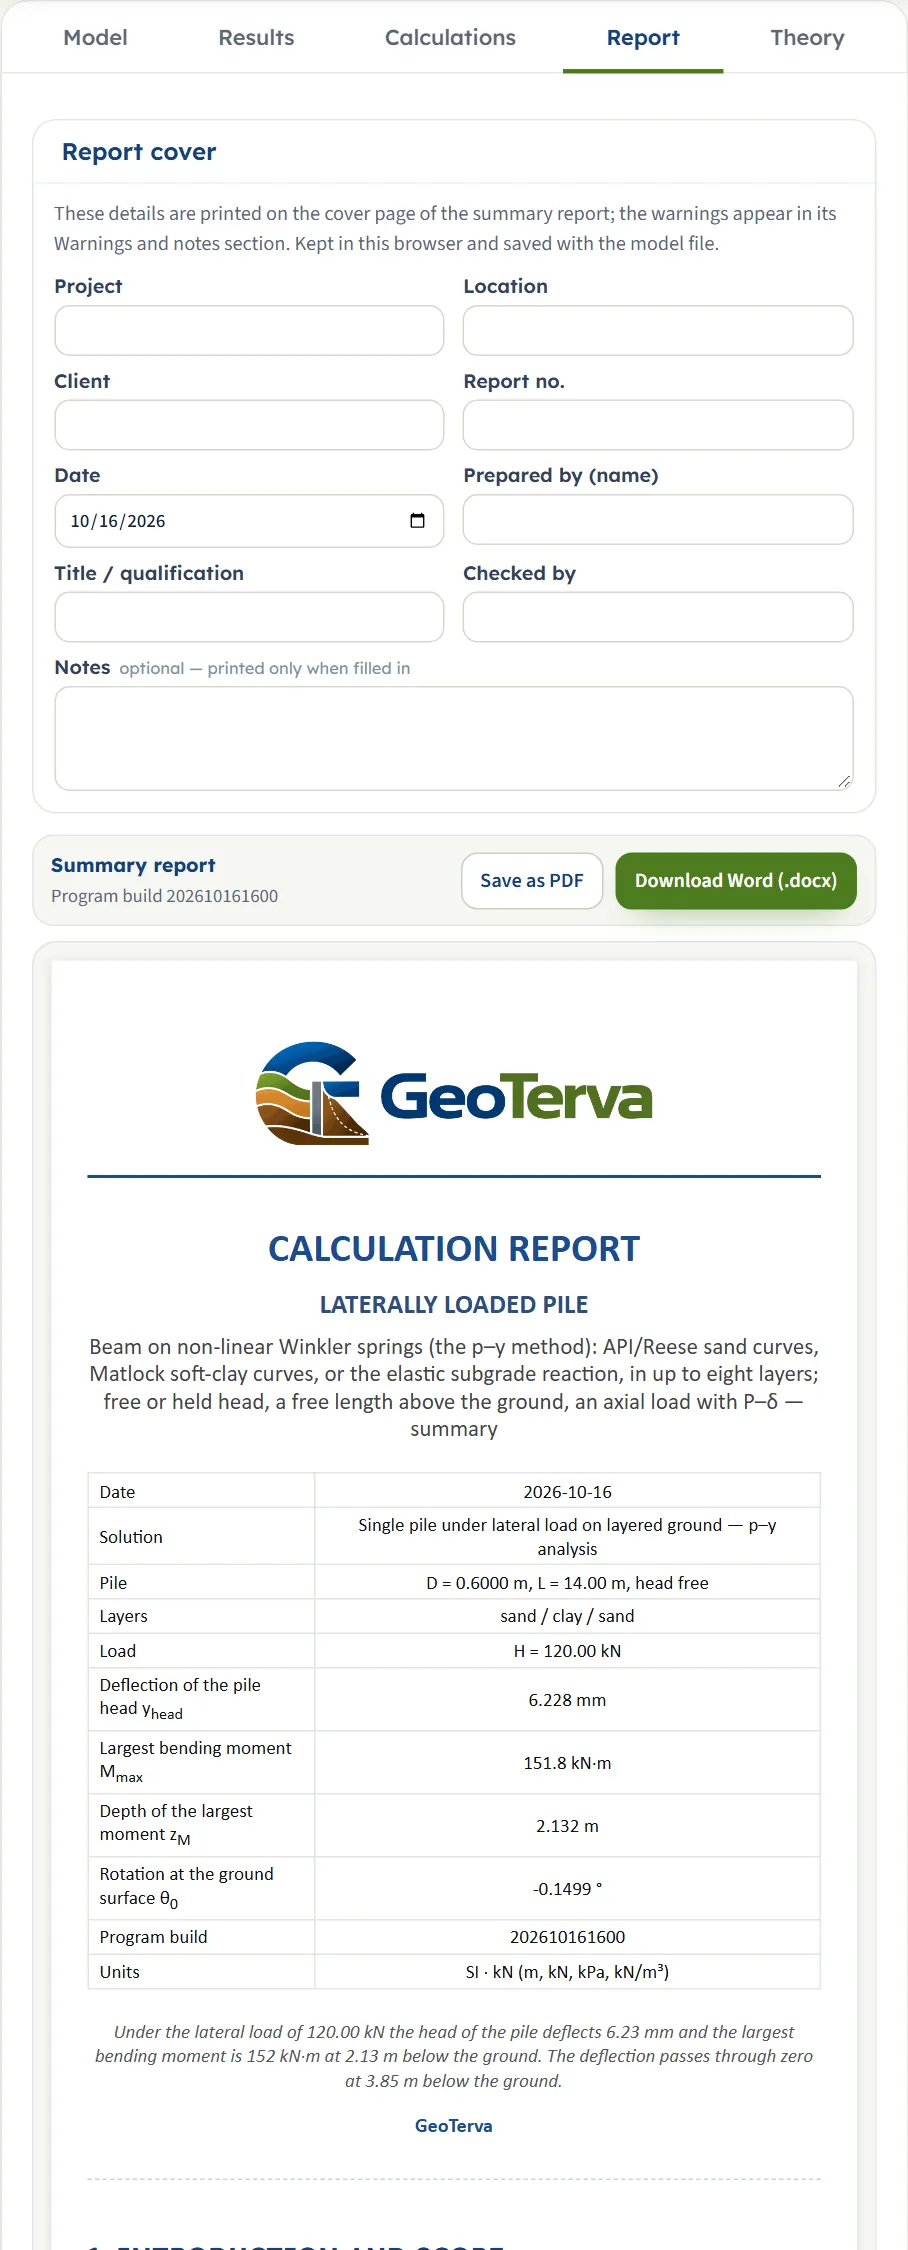
The Report tab turns the same working into a summary report. Fill in the cover (project, location, client, report number, date, prepared by, title, checked by, notes) and press Save as PDF or Download Word (.docx). The report has seven parts: 1 Introduction and scope, 2 Input data, 3 Calculation (one part per step), 4 Results, 5 Assumptions and notes, 6 Summary and 7 References. Part 2 holds the table of the inputs followed by four figures, the views of the drawing: the pile with its deflected shape, the diagrams along the pile, the p–y curves, and the load–deflection curve. Part 5 is printed when the run has assumptions or cautions to state, and part 6 is a short summary in words, for example the head deflection and the largest moment with their depths.
The Theory tab explains the method in fourteen chapters: a pile under lateral load, the pile as a beam on springs, the elastic solutions, the p–y curve of a sand, the p–y curve of a clay, layers and water, the numerical solution, the axial load, the head and the free length, reading the results, the load–deflection curve and the allowable values, a worked example, what the module assumes, and the references.
Worked example: the module’s own example
The module opens on this example. Reset to defaults brings it back at any time, so you can follow the numbers on your own screen. A beam on non-linear springs is solved numerically, so there is no short hand calculation of the answer; what you can do by hand is the input of the solution, the stiffness of the pile and the p–y curves, and then read the result.
| Section | Input | Value |
|---|---|---|
| Soil layers | Layer-1, sand | H = 4 m, γ = 18 kN/m³, γsat = 19 kN/m³, φ′ = 32° |
| Soil layers | Layer-2, clay | H = 5 m, γ = 18 kN/m³, γsat = 19 kN/m³, cu = 40 kPa |
| Soil layers | Layer-3, sand | H = 8 m, γ = 18 kN/m³, γsat = 19 kN/m³, φ′ = 32° |
| Groundwater | Water table | Present, Dw = 2 m |
| Pile | Section, width | Circular, solid; D = 0.6 m |
| Pile | Stiffness, lengths | Ep = 30 000 MPa, fEI = 1; L = 14 m, e = 0 |
| Loading | Head, loading | Free to rotate, static; H = 120 kN, M = 0, P = 0 |
| Soil response | Response | Non-linear p–y curves; k = 20.7 MN/m³ (layer 1) and 11.9 MN/m³ (layer 3), ε50 = 0.02 and J = 0.5 (layer 2), all filled in |
Step 1: the pile
I = π × 0.6⁴ / 64 = 0.006362 m⁴, so E I = 30 000 MPa × 0.006362 m⁴ = 190,852 kN·m².
Step 2: the p–y curves at the middle of each layer
The module works out one curve for the middle of each layer, to show you the numbers; the engine uses the same formulas at every depth. For Layer-1, a sand at z = 2.00 m, the effective stress is σ′ = 18 × 2.00 = 36.00 kPa (the water table is at 2 m). With φ′ = 32°, α = 16°, β = 61° and Ka = tan²29° = 0.3073, the coefficients are C1 = 2.2813, C2 = 2.9473 and C3 = 36.814, and
so pu = the smaller = 227.92 kN/m. The factor A = max(0.9, 3 − 0.8 × 2.00/0.6) = 0.9, and the slope of the curve at the origin is k z = 20.7 MN/m³ × 2.00 m = 41,400 kPa.
For Layer-2, a clay at z = 6.50 m, σ′ = 18 × 2 + (19 − 9.81) × 4.5 = 77.36 kPa and y50 = 2.5 × 0.02 × 0.6 = 0.03 m. Then pus = (3 + 77.36/40 + 0.5 × 6.5/0.6) × 40 × 0.6 = 248.41 kN/m and pud = 9 × 40 × 0.6 = 216.00 kN/m, so pu = 216.00 kN/m. For Layer-3, a sand at 11.5 m with σ′ = 123.31 kPa, pu = 2,723.61 kN/m, where the deep value pud governs. These three are the pu of the step-by-step table on the Results tab.
Step 3: the solution
The pile is divided into 140 beam elements with a node at every layer boundary, and the non-linear equations are solved by Newton’s method, which reaches equilibrium in 7 iterations. The two checks the module writes: the sum of the soil reaction is 120.000 kN against H = 120.000 kN, and the moment at the tip, by statics from the load and the soil reaction, is 0.000 kN·m.
Step 4: reading the result
The head deflects yhead = 6.228 mm and the pile rotates θ0 = -0.1499°. The largest bending moment is Mmax = 151.8 kN·m, 2.132 m below the ground, in the sand of Layer-1, a little below the water table. The deflection passes through zero at z0 = 3.851 m, still in Layer-1. The largest shear force is Vmax = 120.0 kN, which is H, at the head. The largest soil reaction is pmax = 73.99 kN/m at 1.40 m, and the tip moves ytip = -0.001916 mm.
How each input changes the answer
Each row below changes one thing in the example and runs the module again. The numbers are the results the module gives, in mm, kN·m and m, so you can reproduce any row.
| Change | yhead (mm) | Mmax (kN·m) | at zM (m) | z0 (m) | Why |
|---|---|---|---|---|---|
| The example | 6.228 | 151.8 | 2.132 | 3.851 | The reference |
| Head held against rotation | 2.241 | -174.8 | 0 | 4.938 | The head deflection is 36 % of the free head’s (Mmax shown is the moment that holds the head, at the head, negative) |
| Moment M = 60 kN·m at the free head | 7.755 | 199.9 | 1.928 | 3.619 | The moment adds to the deflection the lateral load causes |
| Load 1.5 m above the ground (e = 1.5 m) | 20.23 | 305.6 | 1.679 | 3.373 | yhead is at the load; at the ground surface it is 11.12 mm. The moment at the ground surface is H e = 180 kN·m; the largest moment is below it |
| Cyclic loading | 7.280 | 172.0 | 2.216 | 3.887 | The API cyclic curves; the ground softens |
| Axial load P = 800 kN | 6.324 | 154.5 | 2.132 | 3.829 | The P–δ effect adds a little deflection and moment |
| Cracked section, fEI = 0.6 | 7.925 | 140.1 | 1.951 | 3.454 | A more flexible pile deflects more and takes a smaller largest moment |
| Ep = 40 000 MPa | 5.467 | 159.3 | 2.246 | 4.090 | A stiffer pile deflects less and takes more moment |
| Diameter D = 0.8 m | 3.693 | 184.6 | 2.637 | 4.871 | D enters I and the width the soil reaction acts over: both stiffen the response |
| Hollow pipe, D = 0.6 m, t = 20 mm | 12.70 | 124.6 | 1.691 | 2.941 | The thin wall gives a much smaller I than the solid section |
| Square section, D = 0.6 m | 4.911 | 166.2 | 2.350 | 4.281 | I = D⁴/12 is 1.70 times that of the circular pile |
| Lateral load H = 240 kN (twice) | 15.82 | 347.2 | 2.330 | 3.817 | The deflection grows 2.54 times, the moment 2.29 times: the ground softens |
| Lateral load H = 60 kN (half) | 2.926 | 73.36 | 2.091 | 3.996 | The deflection falls to 0.47 of the reference |
| Pile 17 m long (to the base of the profile) | 6.227 | 151.8 | 2.132 | 3.851 | No change: the tip does not move at 14 m |
| Pile 10 m long | 6.229 | 151.8 | 2.132 | 3.849 | Practically the same: the tip moves 0.02695 mm |
| Pile 6 m long | 6.562 | 147.3 | 2.045 | 3.603 | The tip moves 0.9544 mm: the pile begins to feel its length |
| No water table | 6.224 | 151.8 | 2.132 | 3.863 | Almost no change: only the ground below 2 m is affected, and it is working far below its limit |
| Water table at the surface (Dw = 0) | 9.656 | 182.7 | 2.497 | 4.448 | The sand is submerged from the top: k falls to the submerged value and so does σ′ |
| Loose sand: φ′ = 28° in layers 1 and 3 | 13.41 | 196.9 | 2.798 | 5.136 | k and the ultimate resistance both fall |
| Dense sand: φ′ = 38° in layers 1 and 3 | 3.265 | 122.0 | 1.703 | 3.003 | k and the ultimate resistance both rise |
| Stiffer clay: cu = 100 kPa in layer 2 | 6.150 | 152.5 | 2.142 | 4.205 | The clay is below where the pile works hardest: a small effect |
| Softer clay: cu = 20 kPa in layer 2 | 6.339 | 150.8 | 2.119 | 3.595 | A small effect, the other way |
| Elastic subgrade reaction | 10.49 | 172.8 | 2.488 | 4.098 | With nh = 8 MN/m³ and kh = 15 MN/m³; another ground, not a check of the p–y curves |
Three things stand out. The load, the head and the section matter most: holding the head, doubling the load, or a pipe instead of a solid pile change the answer by a factor of two or more. The top of the pile governs: the length beyond about 10 m and the clay at 4 to 9 m change little. The sand at the top counts for much more than the clay below it: a loose sand (φ′ = 28°) gives +115 % on the head deflection, a water table at the surface +55 %.
The same example in US units gives yhead = 0.2452 in, Mmax = 111.9 kip·ft at zM = 6.996 ft: the same answer, in the other units (0.2452 in is 6.228 mm).
Messages: stops, warnings and notes
The module tells you in plain words when something prevents the calculation, when a result needs care, and what it assumed. There are four kinds. The texts below are the module’s own, run on the example with one change.
| Kind | When | Message and what to do |
|---|---|---|
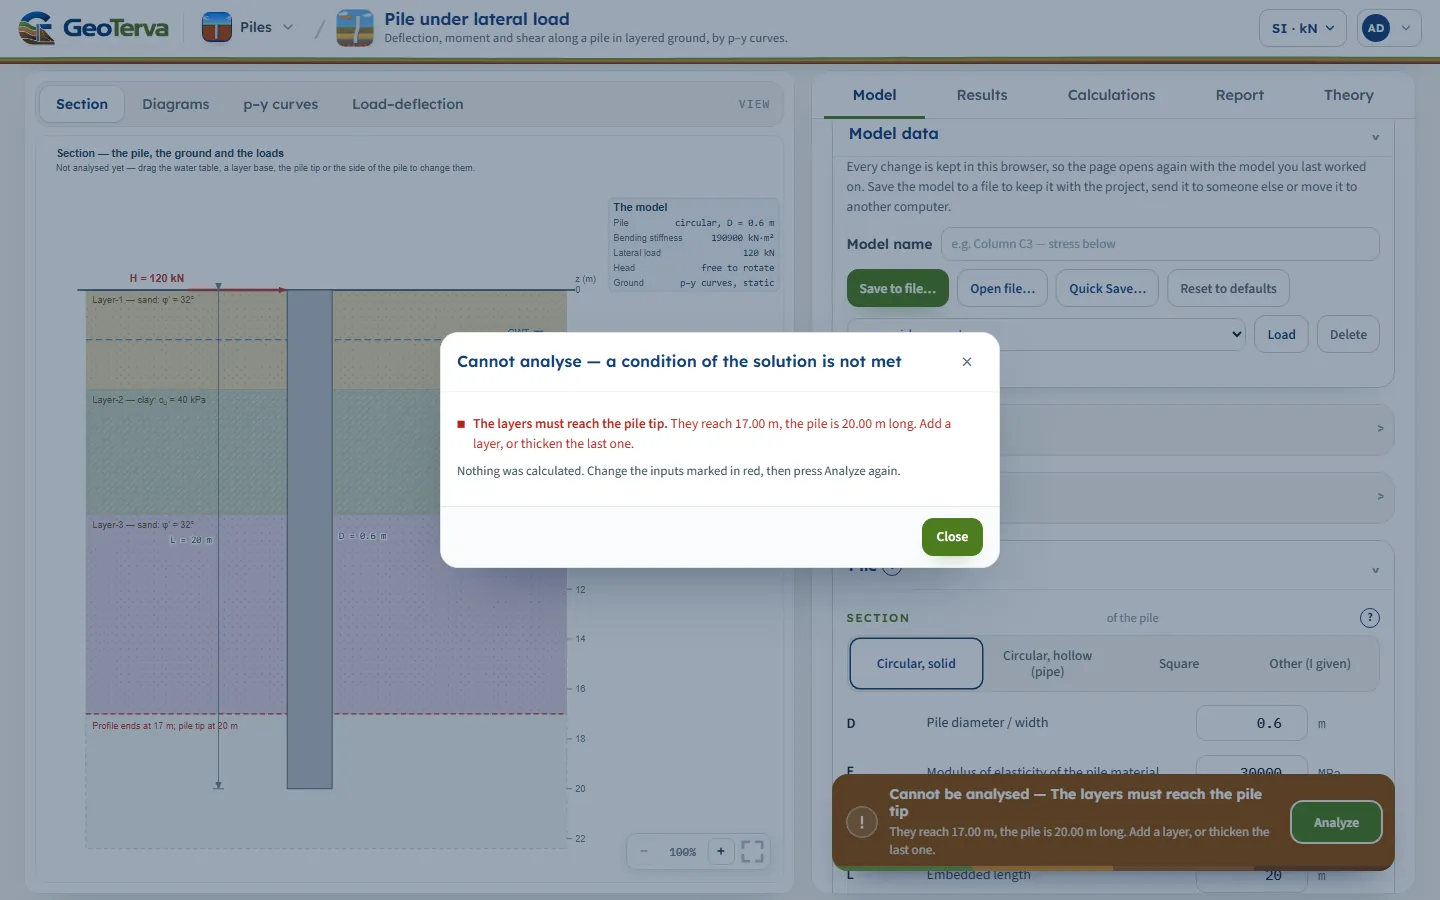
| Stop (brown bar, “Cannot be analysed — …”; the window is titled “Cannot analyse”) | The layers do not reach the pile tip | “The layers must reach the pile tip. They reach 17.00 m, the pile is 20.00 m long. Add a layer, or thicken the last one.” |
| Stop | No load: H = 0 and no moment (free head) | “No load is given. The pile is loaded by the lateral load or the moment at its head. Enter H or M.” With a held head the message asks for H > 0: “a held head takes no moment of its own: the moment that holds it is worked out”. |
| Stop (input error) | A value below the smallest the field accepts, for example φ′ = 10° or D = 0.01 m | The title reads “Cannot analyse — 1 input error”: “Friction angle (φ′1) must be at least 15°.” or “Pile diameter / width (D) must be at least 0.05 m.” Correct the field marked in red. |
| Stop | The wall of a pipe pile is not thinner than its radius | “The wall thickness of the pipe is not between 0 and D/2.” Enter 0 < t < D/2. |
| Stop | γsat not above the unit weight of water | “The saturated unit weight of Layer-1 is not above that of water.” Enter the saturated unit weight of the soil. |
| Stop | The load is more than the pile and the ground can resist (here: a 2.5 m pile under 120 kN) | “The load is more than the pile and the ground can resist: no equilibrium.” The message gives the load the pile and the ground do carry (about 90.3 kN here) and the reason. Lower the load, or lengthen or stiffen the pile. For a very large load the reason is that “the ground moves more than five pile widths”; with an axial load it can be that “the axial load acting through the deflection (P–δ) takes the stiffness that is left”. |
| Stop | The axial load alone buckles the pile in this ground | “The axial load reaches the buckling load of the pile in this ground.” Lower the axial load, or stiffen the pile. |
| Warning | The tip of the pile moves (here: a 5 m pile) | “The pile tip moves 2.48 mm (31 % of the deflection at the ground).” The pile is short for this load and ground: it rotates as a rigid body and its length governs the result. Lengthen the pile until the tip does not move, or accept the deflection of a short pile. It is raised when the tip moves by more than a tenth of the deflection at the ground and by more than 2 mm. |
| Warning | The elastic response is chosen | “Elastic analysis: the reaction of the ground is not limited by its strength.” Where the soil would have yielded in reality, the deflection and the moment are too small. Compare the largest reaction with the ultimate resistance of the ground, or use the p–y curves. |
| Warning | The elastic reaction exceeds the ultimate resistance (here: H = 400 kN) | “The elastic reaction exceeds the ultimate resistance of the ground at z = 0.300 m (218 % of it).” The elastic result is not valid; use the p–y curves. |
| Warning | The head deflection is larger than the allowable value | “The head deflection 6.23 mm exceeds the allowable 4.00 mm.” Lengthen or stiffen the pile, or lower the load. |
| Warning | The largest moment is larger than the moment capacity | “The largest moment 152 kN·m exceeds the moment capacity 120 kN·m.” Strengthen the section, or lower the load. |
| Note | The ground has yielded over more than a fifth of the pile (here: H = 500 kN) | “The ground has reached the end of its p–y curve down to z = 3.00 m.” Over that depth the soil reaction is at its limit: the pile is being pushed through the ground, and the deflection grows quickly with the load. Check the load against the lateral capacity, or lengthen or stiffen the pile. |
| Note | The head deflection (the deflection at the ground when there is a free length) is more than a tenth of the pile width | “The head deflection is more than a tenth of the pile width.” The p–y curves were derived for deflections up to a few per cent of the width; beyond 60 mm here, the result is an extrapolation of them. Compare the deflection with what the structure can bear. |
| Assumption (always listed) | Every run | “The pile is a beam on independent springs, with no shear transfer between them.” |
| Assumption | An axial load is entered | “The axial load acts through the deflected shape, and is taken as constant over the length.” |
| Assumption | The head is held | “The head is held against rotation but free to move sideways.” |
| Assumption | Cyclic loading with p–y curves | “Cyclic loading: the API cyclic curves are used.” |
The Warnings (or Notes) button on the bar lists the cautions, notes and assumptions after a run; the window is titled Warnings (n) when there are cautions and Notes and assumptions (n) when there are only notes and assumptions. The assumptions, and the cautions about elastic ground and a moving pile tip, are printed in part 5 of the report; the verdicts are printed beside the results; the notes and the limit cautions appear on screen only.
Good practice and common mistakes
- Make the pile long enough that its tip does not move. When it moves, the pile turns as a rigid body and its length governs the result; the module cautions you. Lengthen the pile until ytip is practically zero.
- Look at the Diagrams view, not only the numbers. The grey limit of the p–y curve on the soil-reaction diagram shows where the ground is near its limit; a reaction that follows the limit over several metres means the pile is being pushed through the soil and the deflection will grow quickly with the load.
- Describe the top of the ground with care. It is the upper part of the pile that carries the load, and the water table there changes σ′ and the filled-in k.
- Replace a filled-in constant when you have a better one. ε50 from a triaxial test, or a k from your own correlation, beats the standard value.
- Run the load you design for. The loads and the limits are yours, and the module gives the response to exactly those. For the load at a limit (a deflection or a moment), enter the limit in Design instead of scaling the working load by hand: the ground is not linear.
- Use the moment capacity as a check of the section, not as a design of it. The pile is elastic in the module; a section that yields in bending may fail before the ground does, which is what Mcap is for.
- Run the free and the held head when the cap is neither rigid nor flexible: free gives the largest deflection and in-ground moment, held the largest head moment, so each quantity is bounded by the two runs.
- Do not read the elastic result as a check of the p–y result. The elastic constants are your own, so it is a different ground.
- Keep the layers to the tip. The layers must reach the pile tip; add a layer or thicken the last one.
- Read the notes. They list what the module assumed; the assumptions are printed in part 5 of the report, the notes appear on screen only.
Frequently asked questions
How do I calculate the lateral deflection of a pile?
Treat the pile as a beam on non-linear springs, the p–y method: at each depth the ground reacts with a force per unit length p that depends on the deflection y of the pile there. In GeoTerva’s Pile under lateral load module you describe the layers, the pile and the load, press Analyze, and the module solves the beam equation and gives the head deflection, the rotation, the largest bending moment and its depth, and the shear force and soil reaction along the pile.
What is a p–y curve?
A p–y curve is the reaction p of the ground per unit length of pile, against the lateral deflection y of the pile at one depth. It starts steep, flattens as the soil yields and ends on its limit (A pu in sand, pu in clay). GeoTerva uses the API RP 2A curve for sand (Reese, Cox and Koop) and Matlock’s curve for clay, and draws the curves at five depths in the p–y curves view.
What is the difference between a free head and a held head?
With a free head, nothing stops the head turning: the moment at the head is zero (or the one you apply), the pile deflects most at the head and its largest moment is a little below the surface. With a held head a cap keeps the slope at zero: the head moves less and a moment develops at the head to hold it. On the module’s example, holding the head cuts the head deflection from 6.228 mm to 2.241 mm and gives a head moment of -174.8 kN·m, larger than the 151.8 kN·m of the free pile. A real cap lies between the two, so each quantity is bounded by the two runs: free gives the largest deflection and in-ground moment, held the largest head moment.
How does the module treat cyclic loading?
It switches to the cyclic p–y curves of API RP 2A. In sand the factor A is 0.9 at every depth. In clay the curve stops at 0.72 of the ultimate resistance from three times y50 at depth; nearer the surface it then falls to a lower value. On the module’s example, cyclic loading raises the head deflection from 6.228 mm to 7.280 mm.
What does the axial load do to a laterally loaded pile?
The axial load P acts through the deflected shape (the P–δ effect). It is in the beam equation and in the stiffness of every element, so it raises the deflection and the moment. P is the compression you enter at the head, taken as the same at every depth. If it reaches the buckling load of the pile in the ground, the module stops and says so.
What do the signs of the results mean?
The depth z is measured down from the ground surface and the deflection y is positive in the direction of the load. The rotation is the slope dy/dz, so it is negative for a pile that leans over in the direction of the load (-0.1499° on the example). A negative depth is above the ground. The soil reaction p has the sign of the deflection.
How do I find the lateral load for an allowable deflection?
Enter the allowable deflection yall in Design and press Analyze. The module raises the lateral load (and the moment) in proportion, solves the equations again at each load, and gives the lateral load at which the head deflection reaches yall. On the example, 10 mm is reached at 175.7 kN and 5 mm at 98.90 kN. Because the ground is non-linear, the load cannot be scaled from the working load.
When should I use the elastic subgrade reaction instead of p–y curves?
When deflections are small and you work with coefficients of subgrade reaction of your own: nh for a sand (k = nh z) and kh for a clay (k = kh D). The elastic soil has no limit, so it overestimates the reaction as the deflection grows; the module cautions you and, where the elastic reaction exceeds the ultimate resistance of the ground, gives the depth. The non-linear p–y curves are the default.
What values do k, ε50 and J take?
They are filled in for each layer, and you can type over them. For a sand, the initial modulus k comes from φ′ and from whether the middle of the layer lies above or below the water table, from the chart of API RP 2A. For a clay, ε50 is 0.020 for cu below 48 kPa, 0.010 from 48 to 96 kPa and 0.005 from 96 kPa; J is 0.5 for cu below 48 kPa and 0.25 above. Replace them with measured values when you have them.
Why does the module say the pile tip moves?
When the tip deflects by more than a tenth of the deflection at the ground and by more than 2 mm, the pile is short for this load in this ground: it turns as a rigid body and its length governs the result instead of the ground near the top. Lengthen the pile until the tip stays put, or accept the deflection of a short pile.
What does “no equilibrium” mean?
The load is more than the pile and the ground can resist: the ground reaches the end of its p–y curves over so much of the pile that it can no longer hold it, or the ground moves more than five pile widths, where the p–y curves no longer describe it. Nothing is calculated. Lower the load, or lengthen or stiffen the pile.
Does the module give the group effect of several piles?
This module analyses one pile. For a cap with several piles, use the Pile group module, which adds the load on every pile, the group effect and the lateral response of the rows with p-multipliers.