
On this page · 5 chapters
Newmark's influence chart for the vertical stress below a uniformly loaded area of any shape, built from the circle solution. The figures are computed from the equations.
 PDF
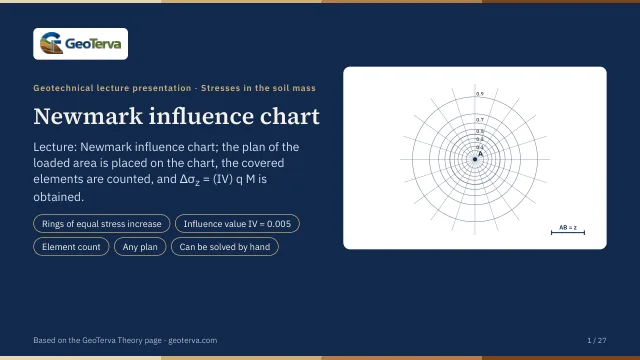
Lecture slides
Ready-made slides for lectures and self-study
The mechanism, the derivation, the equations and the figures of this page, in teaching order. Every slide links back to its chapter.
1The ideaCircles of equal stress increment.
Below the centre of a uniformly loaded circle the stress is Δσz/q = 1 − 1/[(R/z)² + 1]3/2. Turned around, it gives the radius of the circle that produces a chosen stress ratio:
Both sides are nondimensional. Circles with these radii for Δσz/q = 0.1, 0.2 … 0.9 divide the plane into rings, each of which — loaded on its own — adds 0.1q at the depth z below the centre; the last ring (0.9 to 1.0) reaches to infinity.
| Δσz/q | R/z | Δσz/q | R/z |
|---|---|---|---|
| 0.00 | 0.0000 | 0.50 | 0.7664 |
| 0.05 | 0.1865 | 0.55 | 0.8384 |
| 0.10 | 0.2698 | 0.60 | 0.9176 |
| 0.15 | 0.3383 | 0.65 | 1.0067 |
| 0.20 | 0.4005 | 0.70 | 1.1097 |
| 0.25 | 0.4598 | 0.75 | 1.2328 |
| 0.30 | 0.5181 | 0.80 | 1.3871 |
| 0.35 | 0.5768 | 0.85 | 1.5944 |
| 0.40 | 0.6370 | 0.90 | 1.9083 |
| 0.45 | 0.6998 | 0.95 | 2.5235 |
2Newmark's chart200 elements, influence value 0.005.
Newmark (1942) divided the rings by equally spaced radial lines. By symmetry every element of one ring has the same effect, so with N elements in all, each element loaded contributes
of q to the stress below the centre — the influence value. With 10 rings and 20 sectors, N = 200 and IV = 0.005. Since each element's effect is the same wherever it lies on the chart, any loaded area of any shape can be measured by counting elements.
3Using the chartΔσz = (IV) q M.
The procedure:
- Choose the depth z below the loaded area at which the stress is wanted.
- Draw the plan of the loaded area to a scale in which z equals the unit length AB of the chart.
- Place the plan on the chart so that the point below which the stress is wanted lies over the centre of the chart.
- Count the elements M enclosed by the plan, parts of elements estimated.
Then
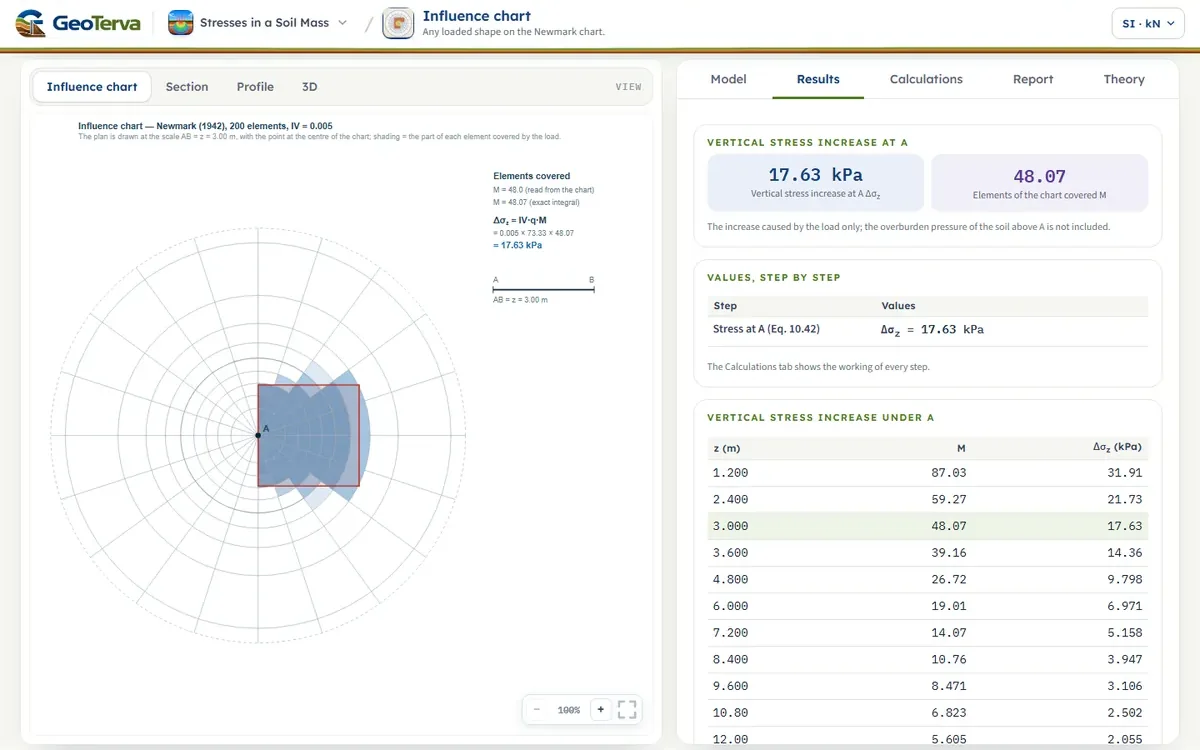
Each depth needs its own drawing of the plan. The module does the drawing for the depth entered (Influence chart view: the covered elements are shaded by the part of them inside the plan). For the count it uses the exact value: Boussinesq's solution is integrated over the polygon in polar co-ordinates about the point — as for a circle — and M = (Δσz/q)/IV. It is what a perfect count would give.
4Worked exampleEvery number computed by the module’s own code.
q = 660/(3 × 3) = 73.33 kN/m² and z = 3 m, so the 3 m square is drawn with sides equal to AB, and A — the middle of its left side — over the centre of the chart:
The module opens with this example; the corners of the plan can be changed to any polygon of up to six corners.
5ReferencesSources.
- Das, B.M. (2018). Principles of Geotechnical Engineering, 9th ed. Cengage Learning.
- Newmark, N.M. (1942). Influence charts for computation of stresses in elastic foundations. University of Illinois Engineering Experiment Station, Bulletin No. 338.
From theory to your own design
Find the stress below your own loaded area in minutes
- The chart with your loaded area drawn on it
- The elements counted and the stress increase, beside the exact integral
- Any polygonal shape
- A clean calculation report, saved as a PDF. Online: nothing to install, no dongle, on a phone, a tablet or a PC