
On this page · 12 chapters
A pile carries its load partly on its tip and partly along its shaft; this page follows the source method by method, with every chart drawn from the same numbers the module uses.
 PDF
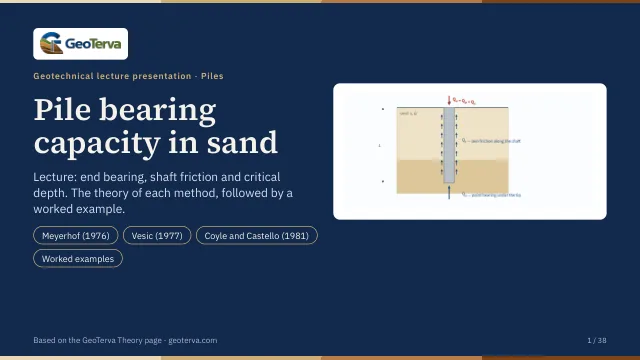
Lecture slides
Ready-made slides for lectures and self-study
The mechanism, the derivation, the equations and the figures of this page, in teaching order. Every slide links back to its chapter.
1What the pile carriesQᵤ = Qₚ + Qₛ and the allowable load.
A pile carries its load in two ways at once: the soil under the tip resists like a deep footing, and the sand along the shaft resists by friction. The ultimate capacity is the sum of the two, and the allowable capacity follows from a single factor of safety on that sum.
This module is for a single pile in sand (c′ = 0), driven or bored, of constant cross section — square or circular. The sand may be described in up to eight layers, each with its own friction angle φ′. Group action, negative skin friction and settlement are separate subjects, each with a calculation of its own.
2Effective stress in the profileWhat the water table changes.
Everything in a sand profile follows the effective vertical stress: both the point resistance and the unit friction are proportional to it. Above the water table the stress grows with the moist unit weight, below it with the submerged unit weight.
The module therefore asks for the layer thicknesses, the unit weights and the depth of the water table; the layers must reach at least the pile tip, or there is no stress to work with at that depth.
3Point bearingqₚ = σ′N*q under the tip.
Under the tip the sand fails in bearing, as under a footing, but confined by the overburden at that depth. For a sand (c′ = 0) only the surcharge term survives, so the unit point resistance is the effective stress at the tip times a bearing-capacity factor of the pile problem, N*q:
The three methods offered differ in where N*q comes from and whether qp is capped.
4Meyerhof (1976)N*q from φ′, with a limiting value.
Sand
The point bearing capacity qp of a pile in sand generally increases with the depth of embedment in the bearing stratum, and reaches a maximum at an embedment ratio Lb/D = (Lb/D)cr. In a homogeneous soil Lb is the actual embedded length L of the pile; where the pile has penetrated into a bearing stratum, Lb is less than L. Beyond the critical embedment ratio the unit point resistance stays constant at ql.
For a pile in sand c′ = 0, so only the surcharge term of the point capacity survives:
with q′ the effective vertical stress at the level of the pile tip. The variation of N*q with the soil friction angle is Meyerhof’s own chart, reproduced below; the interpolated values of that chart, degree by degree, are the series the module reads.
| φ′ (°) | N*q |
|---|---|
| 20 | 12.4 |
| 21 | 13.8 |
| 22 | 15.5 |
| 23 | 17.9 |
| 24 | 21.4 |
| 25 | 26.0 |
| 26 | 29.5 |
| 27 | 34.0 |
| 28 | 39.7 |
| 29 | 46.5 |
| 30 | 56.7 |
| 31 | 68.2 |
| 32 | 81.0 |
| φ′ (°) | N*q |
|---|---|
| 33 | 96.0 |
| 34 | 115.0 |
| 35 | 143.0 |
| 36 | 168.0 |
| 37 | 194.0 |
| 38 | 231.0 |
| 39 | 276.0 |
| 40 | 346.0 |
| 41 | 420.0 |
| 42 | 525.0 |
| 43 | 650.0 |
| 44 | 780.0 |
| 45 | 930.0 |
The point capacity must not exceed the limiting value Apql:
where pa is the atmospheric pressure (100 kN/m² or 2000 lb/ft²) and φ′ the effective friction angle of the bearing stratum. At φ′ = 35° this gives N*q = 143.0 and ql = 5006 kPa, which a pile in a sand of γ = 18 kN/m³ reaches at a depth of about 1.9 m:
The field evidence for the limit
The field evidence for the critical embedment ratio is the load tests on a 457 mm steel pile at the Ogeechee River site, reported by Vesic (1970):
| L (m) | L/D | qp (kN/m²) |
|---|---|---|
| 3.02 | 6.61 | 3,304 |
| 6.12 | 13.39 | 9,365 |
| 8.87 | 19.40 | 11,472 |
| 12.00 | 26.26 | 11,587 |
| 15.00 | 32.82 | 13,971 |
Three things follow from those tests. There is a limiting value of qp, about 12 000 kN/m²; the critical embedment ratio (L/D)cr is about 16 to 18; and the average standard penetration resistance at the site beyond that ratio is about N60 = 30, for which the correlation 4 pa N60 = (4)(100)(30) = 12 000 kN/m² gives the same limit — so the measured plateau and the correlation agree.
5Vesic (1977)The stiffness of the sand enters too.
Sand
Vesic (1977) estimates the point bearing capacity from the theory of the expansion of cavities: the tip is taken to expand a cavity in the soil around it, so the stiffness of the sand enters the answer as well as its strength. On effective-stress parameters,
where σ̄′o is the mean effective normal ground stress at the level of the pile point — not the vertical one:
with Ko the earth-pressure coefficient at rest. Written this way the expression is Meyerhof’s form with a different factor: N*σ = 3N*q/(1 + 2Ko), so the two methods differ in what the factor is built from rather than in the shape of the equation.
The rigidity index
Vesic’s factor is a function of the reduced rigidity index of the soil, which allows for the volume change of the sand in the plastic zone under the tip:
Es is the modulus of elasticity of the soil, μs its Poisson ratio, Gs its shear modulus, and Δ the average volumetric strain in the plastic zone below the pile point. The general ranges of the rigidity index are 75 to 150 for sands of 50 to 80 per cent relative density, and 50 to 75 for silt.
To put numbers to Ir, and through it to Irr, the source uses the approximations of Chen and Kulhawy (1994):
for 25° ≤ φ′ ≤ 45°, with pa the atmospheric pressure (≈ 100 kN/m² or 2000 lb/ft²). The single number the module asks for is m = Es/pa: 100 to 200 for a loose soil, 200 to 500 for a medium dense one and 500 to 1000 for a dense one. Where cone penetration tests are available, Baldi et al. (1981) give Ir = 300/Fr(%) for a mechanical cone and Ir = 170/Fr(%) for an electric one.
The factor
N*σ is then read against Irr and φ′:
| φ′ (°) | reduced rigidity index Irr | |||||||||
|---|---|---|---|---|---|---|---|---|---|---|
| 10 | 20 | 40 | 60 | 80 | 100 | 200 | 300 | 400 | 500 | |
| 25 | 12.12 | 15.95 | 20.98 | 24.64 | 27.61 | 30.16 | 39.70 | 46.61 | 52.24 | 57.06 |
| 26 | 13.18 | 17.47 | 23.15 | 27.30 | 30.69 | 33.60 | 44.53 | 52.51 | 59.02 | 64.62 |
| 27 | 14.33 | 19.12 | 25.52 | 30.21 | 34.06 | 37.37 | 49.88 | 59.05 | 66.56 | 73.04 |
| 28 | 15.57 | 20.91 | 28.10 | 33.40 | 37.75 | 41.51 | 55.77 | 66.29 | 74.93 | 82.40 |
| 29 | 16.90 | 22.85 | 30.90 | 36.87 | 41.79 | 46.05 | 62.27 | 74.30 | 84.21 | 92.80 |
| 30 | 18.24 | 24.95 | 33.95 | 40.66 | 46.21 | 51.02 | 69.43 | 83.14 | 94.48 | 104.33 |
| 31 | 19.88 | 27.22 | 37.27 | 44.79 | 51.03 | 56.46 | 77.31 | 92.90 | 105.84 | 117.11 |
| 32 | 21.55 | 29.68 | 40.88 | 49.30 | 56.30 | 62.41 | 85.96 | 103.66 | 118.39 | 131.24 |
| 33 | 23.34 | 32.34 | 44.80 | 54.20 | 62.05 | 68.92 | 95.46 | 115.51 | 132.24 | 146.87 |
| 34 | 25.28 | 35.21 | 49.05 | 59.54 | 68.33 | 76.02 | 105.90 | 128.55 | 147.51 | 164.12 |
| 35 | 27.36 | 38.32 | 53.67 | 65.36 | 75.17 | 83.78 | 117.33 | 142.89 | 164.33 | 183.16 |
| 36 | 29.60 | 41.68 | 58.68 | 71.69 | 82.62 | 92.24 | 129.87 | 158.65 | 182.85 | 204.14 |
| 37 | 32.02 | 45.31 | 64.13 | 78.57 | 90.75 | 101.48 | 143.61 | 175.95 | 203.23 | 227.26 |
| 38 | 34.63 | 49.24 | 70.03 | 86.05 | 99.60 | 111.56 | 158.65 | 194.94 | 225.62 | 252.71 |
| 39 | 37.44 | 53.50 | 76.45 | 94.20 | 109.24 | 122.54 | 175.11 | 215.78 | 250.23 | 280.71 |
| 40 | 40.47 | 58.10 | 83.40 | 103.05 | 119.74 | 134.52 | 193.13 | 238.62 | 277.26 | 311.50 |
| 41 | 43.74 | 63.07 | 90.96 | 112.68 | 131.18 | 147.59 | 212.84 | 263.67 | 306.94 | 345.34 |
| 42 | 47.27 | 68.46 | 99.16 | 123.16 | 143.64 | 161.83 | 234.40 | 291.13 | 339.52 | 382.53 |
| 43 | 51.08 | 74.30 | 108.08 | 134.56 | 157.21 | 177.36 | 257.99 | 321.22 | 375.28 | 423.39 |
| 44 | 55.20 | 80.62 | 117.76 | 146.97 | 172.00 | 194.31 | 283.80 | 354.20 | 414.51 | 468.28 |
| 45 | 59.66 | 87.48 | 128.28 | 160.48 | 188.12 | 212.79 | 312.03 | 390.35 | 457.57 | 517.58 |
For the worked pile of this module (φ′ = 35°, m = 250, q′ = 360 kPa at the tip) the chain runs Ko = 0.426, σ̄′o = 222.3 kPa, μs = 0.25, Ir = 39.7, Δ = 0.0090, Irr = 29.2 and N*σ = 46.7, so qp = 10389 kPa.
6Coyle & Castello (1981) — pointN*q read from a chart of load tests.
Coyle and Castello (1981) analysed 24 large-scale field load tests of driven piles in sand. On the basis of those results they suggested, for sand,
with q′ the effective vertical stress at the pile tip and N*q a bearing capacity factor that varies with the embedment ratio L/D as well as with the friction angle:
Two things are worth reading off this chart. The factor is smaller than Meyerhof’s — at φ′ = 35° and a deep pile it is around 34 against Meyerhof’s 143 — because it is fitted to measured capacities rather than to a failure mechanism. And it falls once the embedment ratio passes about twenty, so a longer pile of the same diameter earns a smaller factor, which is the same observation Meyerhof meets with his limiting value.
7Skin frictionf = K σ′ tan δ′ on the shaft.
The frictional, or skin, resistance is the unit friction summed over the surface of the shaft:
with p the perimeter of the pile section, ΔL the length over which p and f are taken to be constant, and f the unit friction at that depth. The unit friction itself is hard to estimate, and the source lists four things to keep in mind.
- How the pile is installed. Driving a pile into sand densifies the soil around it; the zone of densification may reach some 2.5 pile diameters into the sand.
- The way f varies in the field. It increases with depth roughly linearly to a depth L′ and stays constant below it; L′ may be fifteen to twenty pile diameters.
- The displacement of the pile. At the same depth in loose sand, a high-displacement pile earns a higher unit friction than a low-displacement one.
- Boring or jetting. At the same depth, a bored or jetted pile earns a lower unit friction than a driven one.
Taking those factors together, the unit friction is written as
where K is the effective earth-pressure coefficient, σ′o the effective vertical stress at the depth in question, and δ′ the soil–pile friction angle. In reality K varies with depth: it is roughly the Rankine passive coefficient at the top of the pile, and can be less than the at-rest coefficient deeper down. The averages recommended for use are these:
| Pile type | K |
|---|---|
| Bored or jetted | ≈ Ko = 1 − sin φ′ |
| Low-displacement driven | ≈ Ko to 1.4Ko = 1.4(1 − sin φ′) |
| High-displacement driven | ≈ Ko to 1.8Ko = 1.8(1 − sin φ′) |
8The critical depthWhy the friction stops growing.
Measured friction does not keep growing with depth the way the effective stress does. Past a critical depth the unit friction levels off; the source puts that depth at fifteen to twenty pile diameters and takes the conservative estimate
The usual explanation is arching: the sand around the shaft stops transferring the full overburden onto the pile. Below L′ the module holds the effective stress at its value at L′, so the unit friction is constant from there to the tip:
The area under the right-hand curve, times the perimeter, is Qs. The module marks L′ on the section and on the profile, and integrates depth by depth, so a water table or a change of layer inside the upper part of the shaft is carried properly.
9Coyle & Castello (1981) — shaftOne average stress over the length.
Coyle and Castello (1981), alongside the point-bearing method of their own, proposed that the shaft resistance be computed once, with the average effective overburden pressure over the embedded length:
The lateral earth-pressure coefficient K of that expression was determined from field observations, and is read against the embedment ratio and the friction angle:
There is no separate critical depth in this method — the averaging plays that part, which is why the two shaft routes can differ by a wide margin on a long pile.
10Allowable capacityOne factor of safety on the sum.
The ultimate capacity is the sum of the two parts, and the allowable capacity carries one factor of safety over the whole of it:
A factor of 2.5 to 4 is usual for a single pile, the higher end where the ground is known only from a few boreholes or where the capacity leans heavily on the point. Enter the working load and the module checks it against Qall.
11Worked exampleThe 20 m pile, by each method.
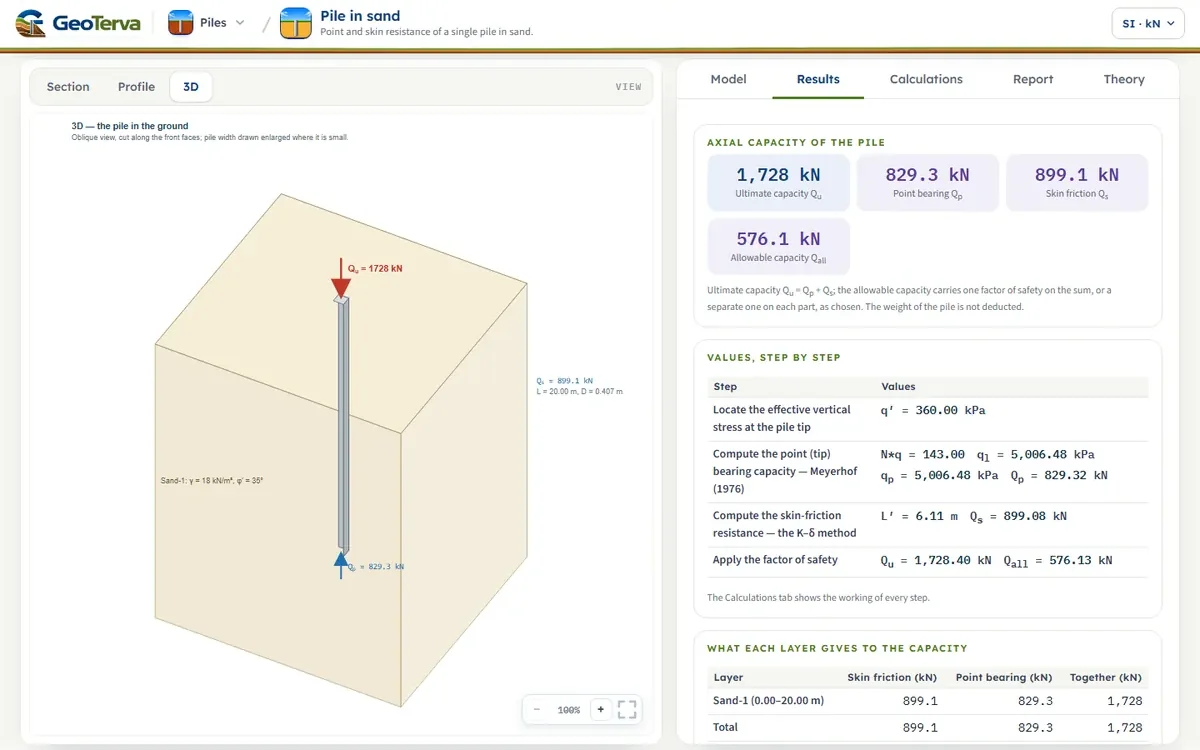
A 20 m concrete pile, 0.407 m square, driven in sand with γ = 18 kN/m³ and φ′ = 35°, no water table. The effective stress at the tip is σ′ = 360.0 kPa.
The point, by each method
The shaft, by each method
With the K–δ friction and Meyerhof's point, Qu = 2925 kN and, at FS = 3, Qall = 975 kN. The module opens with this pile; the figures of the shaft by K–δ follow when K = 1.3 and δ′ = 28° are typed over the values it fills in.
12ReferencesSources.
- Das, B.M. (2016). Principles of Foundation Engineering, 8th ed. Cengage Learning; this page follows it.
- Meyerhof, G.G. (1976). Bearing capacity and settlement of pile foundations. Journal of the Geotechnical Engineering Division, ASCE, 102(GT3), 197–228.
- Vesic, A.S. (1977). Design of Pile Foundations. NCHRP Synthesis of Highway Practice 42, Transportation Research Board.
- Coyle, H.M. and Castello, R.R. (1981). New design correlations for piles in sand. Journal of the Geotechnical Engineering Division, ASCE, 107(GT7), 965–986.
From theory to your own design
Find the capacity of your own pile in sand in minutes
- The point and the skin resistance, the ultimate and the allowable capacity
- The method you choose for the point and for the shaft
- The unit skin friction down the pile and a 3D view of the pile in the ground
- A clean calculation report, saved as a PDF. Online: nothing to install, no dongle, on a phone, a tablet or a PC