
On this page · 14 chapters
The module checks whether liquefaction is triggered at each SPT test below the groundwater table, with the SPT-based procedure of Idriss & Boulanger (2014). For every borehole it gives the factor of safety against depth, the depth ranges where liquefaction is triggered and a project summary of all boreholes.
 PDF
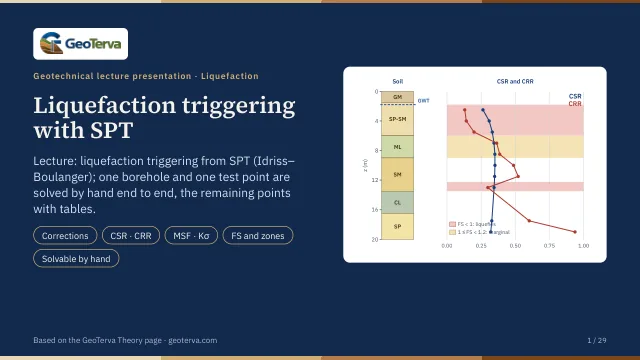
Lecture slides
Ready-made slides for lectures and self-study
The mechanism, the derivation, the equations and the figures of this page, in teaching order. Every slide links back to its chapter.
1Scope
Consequences of liquefaction — settlement, lateral spreading, loss of bearing capacity — are outside this version.
2Screening of the tests
A test is evaluated when it lies below the groundwater table, not deeper than zmax, and in soil that behaves like sand. Soil is clay-like when its plasticity index is at least PIlim (7 by default); when PI is not given, a CL, CH, OL, OH or PT symbol marks it clay-like. Clay-like soil can soften under cyclic loading but does not liquefy in the sense used here, so it is left to a cyclic-softening check.
Tests that are not evaluated stay in every table, with the reason.
3Stresses
γ above the groundwater table and γsat below it, layer by layer; hydrostatic pore pressure from the groundwater depth of the borehole.
4SPT corrections
| Factor | Value |
|---|---|
| CE — hammer energy | ER / 60 |
| CB — borehole diameter | 65–115 mm: 1.00 · 150 mm: 1.05 · 200 mm: 1.15 |
| CS — sampler | standard: 1.00 · without liners: 1.1–1.3 (1.2 used) |
| CR — rod length L = z + L0 | < 3 m: 0.75 · 3–4: 0.80 · 4–6: 0.85 · 6–10: 0.95 · ≥ 10: 1.00 |
5Overburden correction
The exponent depends on the result, so CN is found by iteration; (N1)60cs is limited to 46 in m. Pa = 101.3 kPa.
6Fines content
FC is the laboratory value of the test when one is given, otherwise the value of its layer.
7Cyclic stress ratio
8Cyclic resistance ratio
The curve is used up to (N1)60cs = 37; a denser test is evaluated at that limit.
9Magnitude scaling factor
10Overburden factor
11Factor of safety
| Result | Condition |
|---|---|
| Triggered | FS < 1.0 |
| Marginal | 1.0 ≤ FS < FSreq |
| OK | FS ≥ FSreq |
FSreq is an input: set it from the project specification or the code that applies.
12Zones and thickness
Each evaluated test stands for its layer from halfway to the test above to halfway to the test below; at a layer boundary or at the groundwater table the interval stops there. Neighbouring intervals with the same result are merged into zones, and the triggered thickness of a borehole is the sum of its zones with FS < 1.0.
13References
- Boulanger, R.W., Idriss, I.M. (2014). CPT and SPT based liquefaction triggering procedures. Report UCD/CGM-14/01, University of California, Davis.
- Idriss, I.M., Boulanger, R.W. (2008). Soil liquefaction during earthquakes. EERI, MNO-12.
- Boulanger, R.W., Idriss, I.M. (2006). Liquefaction susceptibility criteria for silts and clays. J. Geotech. Geoenviron. Eng., 132(11).
- Youd, T.L. et al. (2001). Liquefaction resistance of soils: summary report from the 1996 NCEER and 1998 NCEER/NSF workshops. J. Geotech. Geoenviron. Eng., 127(10).
- Seed, H.B., Idriss, I.M. (1971). Simplified procedure for evaluating soil liquefaction potential. J. Soil Mech. Found. Div., 97(SM9).
14Colour-band section
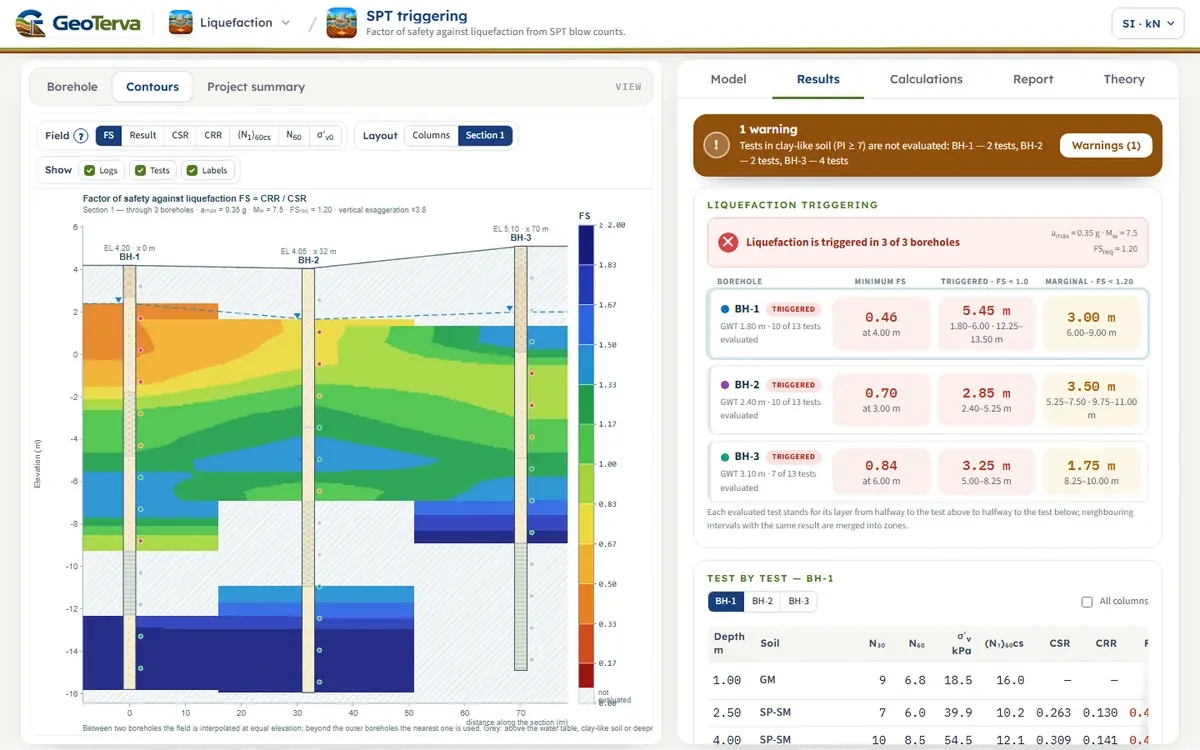
The Contours view paints a field over the boreholes: each borehole gives the field against depth from its SPT results (interpolated between neighbouring tests); with a section line the field is interpolated linearly between neighbouring boreholes at equal elevation and the nearest borehole is used beyond the outer ones; without a section line every borehole is drawn as its own colour column. Grey means not evaluated: above the water table, clay-like soil or deeper than zmax.
From theory to your own design
Check liquefaction at your own site in minutes
- The corrected blow count, the cyclic stress and resistance ratios and the factor of safety, test by test
- Triggered and marginal zones, and sections between boreholes
- A project summary and a Word report
- A clean calculation report, saved as a PDF. Online: nothing to install, no dongle, on a phone, a tablet or a PC